Jira Reports: 21 Examples and the Question Each One Answers
On this page
The sprint review starts in ten minutes and someone asks: “Are we on track?” You open Reports. Jira shows a dashboard of donut charts. Behind a small More reports button sit 21 more charts with names like Release Burndown and Time Since Issues. Which one answers the question?
We opened the Reports tab on every kind of space on our Jira Cloud test site on 14 November 2026, counted what each one offers and read the numbers they gave for the same work.
Short answer: Jira reports live under Reports in the space navigation. The space insights dashboard opens first; the classic reports sit behind More reports. Pick the report by the question. Will we finish the sprint: Burndown Chart. What got done and what was added mid-sprint: Sprint Report. How much per sprint: Velocity Chart. Where work piles up: Cumulative Flow Diagram. Is the backlog growing: Created vs. Resolved. When will the version ship: Version Report. The board decides what you get: a scrum board offered 21 reports on our site, a kanban board 13 and a business space 9. One catch: reports disagree on what “done” means, so the same space can show 8 finished items in one chart and 7 in the next.
Which report answers which question
Start from the question, not from the report list. “Needs” is what the report will not run without. “Counts done by” is the rule it uses to decide a work item is finished, which is where most wrong numbers come from.
| Your question | Report | Needs | Counts done by |
|---|---|---|---|
| Will we finish the sprint? | Burndown Chart | scrum board, an estimate | the board’s last column |
| Is the scope growing during the sprint? | Burnup Chart | scrum board, an estimate | the board’s last column |
| What did we finish, and what was added mid-sprint? | Sprint Report | scrum board | the board’s last column |
| How much does the team finish per sprint? | Velocity Chart | scrum board, an estimate | the board’s last column |
| Where is work piling up? | Cumulative Flow Diagram | a board | the board’s columns |
| How long does work take from start to finish? | Control Chart, Cycle Time Report | company-managed board | the statuses you select |
| How far along is this epic? | Epic Report, Epic Burndown | an estimate; Epic Burndown needs sprints | the board’s last column |
| When will the release ship? | Version Report, Release Burndown | scrum board, fix versions, an estimate | the board’s last column |
| Is the backlog growing or shrinking? | Created vs. Resolved Issues | a space or a saved filter | the Resolution field |
| Are we keeping up with new work? | Recently Created Issues | a space or a saved filter | the Resolution field |
| How old is the open work? | Average Age | a space or a saved filter | the Resolution field |
| How long does resolving take? | Resolution Time | a space or a saved filter | the Resolution field |
| What is the work made of (by assignee, priority)? | Pie Chart, Single Level Group By | a saved filter (Group By shows 1,000 at most) | current values, no rule |
| How many items had a date set on each day? | Time Since Issues | a space or a saved filter, a date field | the date field you pick |
| Are the time estimates holding? | Time Tracking Report | time tracking switched on, a fix version | logged time and estimates |
| Who has the most work left? | Workload Pie Chart | time tracking switched on | workload per assignee |
| How often do we deploy? | Deployment Frequency Report | CI/CD connected, work item keys in commits | production deployments |
| Are we meeting our SLAs? (service spaces) | SLA success rate, SLA met vs breached | Jira Service Management | the SLA’s own clock |
| What is happening in the space right now? | Space insights (Team overview) | nothing, it opens first | status category or Resolution |
The last column matters more than it looks. Three different rules sit in it: the board’s last column, the Resolution field and the status category. The section on our test space below shows what that does to the numbers.
What your space offers
Atlassian’s Generate a report page lists the reports by space type, one line each. We opened the More reports dialog on four kinds of space and counted what it really contained.
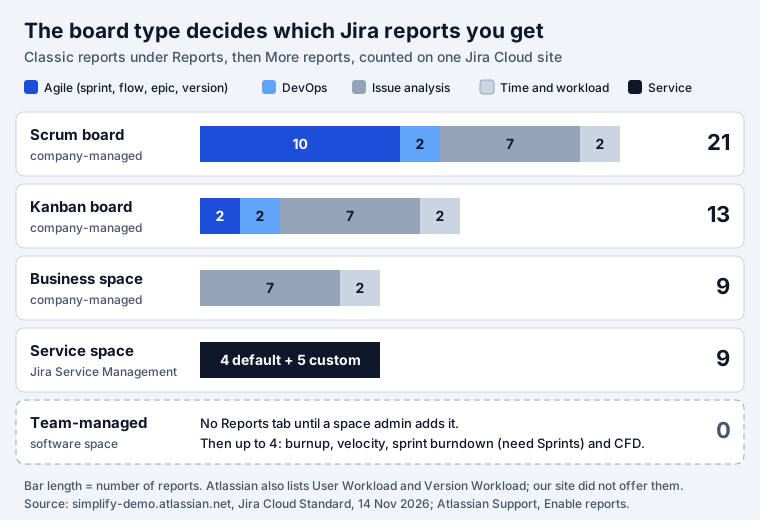
| Space | Reports offered | What is in the list |
|---|---|---|
| Company-managed scrum board | 21 | Burndown, Burnup, Sprint Report, Velocity, Cumulative Flow Diagram, Version Report, Epic Report, Control Chart, Epic Burndown, Release Burndown; Cycle Time, Deployment Frequency; 7 issue analysis; Time Tracking; Workload Pie Chart |
| Company-managed kanban board | 13 | Cumulative Flow Diagram, Control Chart; Cycle Time, Deployment Frequency; 7 issue analysis; Time Tracking; Workload Pie Chart |
| Company-managed business space | 9 | 7 issue analysis (Average Age, Created vs. Resolved, Pie Chart, Recently Created, Resolution Time, Single Level Group By, Time Since); Time Tracking; Workload Pie Chart |
| Service space (JSM) | 9 | Default: Workload, Satisfaction, Requests deflected, Requests resolved. Custom: Created vs Resolved, Time to resolution, SLA success rate, SLA met vs breached, Resolution by component |
| Team-managed software space | 0 | No Reports tab on our space. A space admin adds it; then burnup, velocity and sprint burndown (all three need Sprints) and the cumulative flow diagram |
Three things the documentation does not make obvious:
- Two reports from Atlassian’s list were missing. The docs list User Workload and Version Workload as time-tracking reports. Our site has time tracking on (the Time Tracking Report was there), yet neither appeared in the dialog of any space.
- Team-managed spaces can have no Reports at all. Our team-managed software space showed Summary, List, Board, Development, Forms, Timeline and Docs, and the reports address returned “not found”. Atlassian’s Enable reports page explains it: “Only space admins can enable and disable features for their spaces.” They select Reports, then Add to navigation. Even then, “Burnup and Velocity reports won’t be available if you don’t have the Sprints feature enabled”.
- A business space gets no agile reports. No board columns, no sprints, so only the reports that read fields: the issue analysis set and the two time reports.
Space insights opens first
Today Reports does not open a report. It opens a dashboard called space insights, with the classic catalogue one click away. Atlassian’s page What are space insights? sets its limits:
- “When you select Reports in Jira, the Team overview dashboard opens by default.”
- “A Jira space can contain up to five Space insight dashboards.”
- “The space insights page can only display data from one Jira space.” For several spaces on one page you still need a Jira dashboard.
The classic reports and the insights also look at different work. Atlassian: “Classic Jira reports run against the board you’re currently viewing”, while space insights “use data from the entire Jira space and aren’t scoped to the selected board or board filter.” A space with two boards can show two different velocities and one insights dashboard that matches neither board.
On our scrum space the Team overview held four counters (completed, updated, created and due in the last or next 7 days), donuts by status, type and assignee, a creation trend, cycle time and lead time charts, a completion trend and a table of work items. Every chart had an Export action, which the classic reports lack.
One space, two answers to “how much is done”
Here is what the reports said about the same 12 work items in our scrum space, Sprint Lab. Its board has four columns: To Do, In Progress, Released and Done. Released is a green, Done-category status that we placed one column before Done. It is the kind of status teams add when work ships before it is signed off.
| Rule | What reads it | Search that matches it | Items done |
|---|---|---|---|
| The board’s last column | Sprint Report, Velocity, Burndown, Burnup, Cumulative Flow, Epic and Version | project = SPR AND status = Done | 7 |
| The Resolution field | Created vs. Resolved, Resolution Time, Average Age, Recently Created | project = SPR AND resolution is not EMPTY | 7 |
| The status category | Kanban boards, statusCategory JQL, and matches the space insights “completed” card | project = SPR AND statusCategory = Done | 8 |
The difference is one story, SPR-9, sitting in Released with no resolution. What each report did with it:
- Space insights gave both answers. The top card said “8 work items completed in
the last 7 days”, the same number as
statusCategory = Done. The Work item completion trend chart on the same page plots by “Work item resolution date” and its bar stopped at 7: 6 stories and 1 sub-task. - Created vs. Resolved for the last 30 days returned 12 created and 7 resolved. The Resolution field decides; Atlassian’s best practices page says work items appear in the resolved series “if the “Resolution” field is set, regardless of the ticket’s status.”
- The Sprint Report listed SPR-9 under work not completed. When we dragged Released into the Done column, a closed sprint’s completed points went from 8 to 10, because velocity and the sprint report are recalculated from today’s column mapping. Dragging it back restored 8.
- The Velocity Chart drew its average line at 5.33, which is (8 + 0 + 8) / 3: it counted a sprint with nothing completed. Our velocity and burndown tests show this step by step.
Two settings make the reports agree. Map every Done-category status to the last column of the board, and set a Resolution on every transition into Done. Our post on Jira status categories lists which statuses sit in which category and which part of Jira reads which rule.
The reports, one by one
Short notes for each report, with the facts from Atlassian’s own page that change how you read it.
Sprint reports: burndown, burnup, sprint report, velocity
All four need a scrum board and are “board-specific”, so they only count work items that match the board’s filter. The burndown chart shows remaining work against a grey guideline; “Story Points on subtasks are not included”. The burnup chart draws scope separately: if the red work scope line “increases throughout the sprint, it’s a sign of scope creep.” The sprint report is the one for retrospectives: “Work items added after the sprint starts are indicated with an asterisk.” The velocity chart compares commitment with completed work per sprint. The details of all four, tested, are in Jira velocity and burndown and Jira sprints.
Cumulative Flow Diagram
One coloured band per board column, over any period. Atlassian’s reading rule for the cumulative flow diagram: “If your chart contains an area that is widening vertically over time, the column that equates to the widening area will generally be a bottleneck.” It counts work that has passed through a column, not only what sits there now, so moving a card back does not shrink the To Do band. It works on scrum and kanban boards, which makes it the main flow report for kanban teams.
Control Chart and Cycle Time
The control chart “shows the cycle time (or lead time) for your product, version, or sprint”, using the statuses you select as “working”. It applies to company-managed spaces only. One reading trap: once the longest item is 30 days or more, the vertical axis switches to “a cube-root power scale”, which squeezes the outliers. On our scrum space the newer cycle time and lead time charts in space insights were empty for a space with 7 resolved items, so check that a chart has data before you quote it. What the control chart counts, and why the three things Jira calls cycle time disagree, we tested in Jira cycle time.
Epic Report and Epic Burndown
The epic report “shows a list of complete, incomplete, and unestimated work items in an epic”. The epic burndown predicts how many sprints are left from the work completed in the last three sprints, and Atlassian warns that this velocity is “not the same as the velocity described in the Velocity Chart”. Both ignore unestimated work when they predict, so an epic of unestimated stories looks almost finished.
Version Report and Release Burndown
Both answer “when will it ship” for a fix version. The version report draws a predicted release date with an optimistic and a pessimistic band: the average daily velocity plus or minus 10%. It stays blank until “10% of the estimated work for the version” is complete, and it leaves out sub-tasks. The release burndown does the same per sprint and marks the share of unestimated work in red “when the percentage is above 30%”. Treat a red label as “this date is a guess”. What releasing the version then does to unfinished work, tested step by step: Jira fix version.
Issue analysis reports
Seven reports that read fields instead of board columns, so they work in every company-managed space, on a space or a saved filter:
- Created vs. Resolved: “Areas in red show periods where more work items were created than resolved.” The quickest answer to “is the backlog growing”.
- Recently Created Issues: created per day, split into resolved (green) and still open (red).
- Average Age: how long unresolved work has been open.
- Resolution Time: how long resolving took.
- Pie Chart and Single Level Group By: the work split by one field. Group By has “a display limit of 1,000 work items”.
- Time Since Issues: how many items had a chosen date (created, updated, due) set on each day.
All but the last two lean on the Resolution field. A team that never sets it sees a backlog that only grows.
Time tracking reports
The Time Tracking Report and the Workload Pie Chart are “only available if your Jira administrator has enabled time tracking”. The Time Tracking Report works per fix version, compares logged time with the original estimate and “can only display up to 1,000 work items and 1,000 sub-tasks”.
Deployment Frequency
The deployment frequency report stays empty until Jira gets data from your pipeline: “you need deployment events from your CI/CD tool and commit events from your source code management tool”, and work item keys in “branch names, commit messages, and pull requests”.
What the built-in reports do not do
Every report above draws a chart. None of them writes a sentence, sends itself on a schedule or looks across spaces. For those jobs:
- A written weekly status report. Our Jira status report template gives six sections and the JQL that fills each. Report Assistant is our app for the writing part: a Rovo agent drafts your daily or weekly report from your own Jira activity, in your template, and you copy it to Slack or Confluence.
- A report by email every Monday. Jira Cloud cannot email a report or a dashboard. Filter subscriptions and automation rules come close; automated Jira reports compares the six native ways and their limits.
- Several spaces on one page. Build a Jira dashboard from gadgets.
- A weekly SLA report for a service desk. The service space reports show SLA success, not a week you can keep. SLA Reports stores a weekly or monthly report per service space with compliance, breaches and the change against the previous period, and exports CSV.
- Throughput and ageing work next to the board. On a kanban board the built-in choice is the CFD and the control chart. Kanban Status Board shows how many days each card in progress has been in its status and a weekly throughput chart for the last 12 weeks, beside the board.
- The filter behind a report. Pie Chart, Created vs. Resolved and the other issue analysis reports are only as good as their saved filter. Our JQL cheat sheet has tested queries, and JQL Blocks builds JQL from blocks for people who do not want to type it.
How we tested
Site: simplify-demo.atlassian.net, Jira Cloud Standard, 12 spaces, read on 14 November 2026 in a signed-in browser. We changed no settings for this post.
- Catalogue: opened Reports, then More reports, on a company-managed scrum board (SPR), a company-managed kanban board (WEB), a company-managed business space (TT), a service space (HELP) and a team-managed software space (KAN), and copied the names in the dialog.
- Counts:
POST /rest/api/3/search/approximate-countfor the three “done” searches above, and the Created vs. Resolved gadget data for space SPR over 30 days. - Insights: read the Team overview dashboard of SPR, including the completion trend chart.
- Earlier tests: the velocity average, the column remap and the sprint report results come from the sprints we ran on the same board for Jira velocity and burndown on 11 November 2026.
Report pages quoted here were fetched on 14 November 2026. Jira Cloud changes often; if a count in the More reports dialog differs on your site, the plan, time tracking and space type are the first three things to check.
Frequently asked questions
How do I run a report in Jira?
Open the space and select Reports in the space navigation. Jira opens the space insights dashboard first. Select More reports to open the classic catalogue and pick a report. In a company-managed space the classic reports run against the board you are viewing, so switch to the right board first. In a team-managed space a space admin may have to add the Reports tab first.
What is the difference between Jira reports and dashboards?
A report is a fixed chart for one board, space or filter, such as the sprint report or the velocity chart. A Jira dashboard is a page of gadgets you arrange yourself and it can show many spaces at once. Space insights sit in between: the Reports tab of one space, up to five dashboards per space, built from widgets. Use a dashboard when you need several spaces on one page.
Which Jira reports work on a kanban board?
On a company-managed kanban board our site offered 13: Cumulative Flow Diagram and Control Chart, the Cycle Time and Deployment Frequency reports, the seven issue analysis reports such as Created vs. Resolved, and the Time Tracking and Workload Pie Chart reports. Burndown, burnup, velocity, sprint and version reports need a scrum board.
Can I export a Jira report?
Partly. Each chart on a space insights dashboard has an Export action. The classic reports have no export button; Atlassian suggests the browser print function for some of them. For the raw data, run the same search in the list of work items and export it to CSV or Excel.
Why can't I see the velocity chart or the burndown chart?
Both need sprints. Atlassian: "The velocity chart can only be accessed if you're using the Scrum space template." In a team-managed space they also need the Sprints feature switched on. A kanban board does not offer them at all.
Can Jira email a report on a schedule?
Not a report or a dashboard. You can subscribe to a filter, which emails a list of work items, or build an automation rule that sends a digest. Our post on automated Jira reports compares the six native ways and their limits.
Which Jira reports need story points?
The burndown, burnup, velocity, epic, epic burndown, release burndown and version reports measure work by an estimate. Story points are the usual choice, but they also accept original time, work item count or another numeric field. With work item count they still run, they just count items instead of points.