Jira Velocity and Burndown Charts: What They Count, Tested
On this page
The planning meeting opens with the velocity chart. “Average: 5.33,” someone reads, and the team plans five points. Two of the last three sprints delivered 8. The third delivered nothing because its only story ended in a column that is not the board’s last one. The line averages all three.
We ran sprints on a Jira Cloud scrum board on 11 November 2026 and checked each number in the velocity chart, the burndown chart and the burnup against what we had done to the work.
Short answer: the velocity chart shows two bars per sprint. Commitment is the estimate of the work in the sprint when it started; added work and re-estimates do not change it. Completed is the estimate of the work in the board’s last column when the sprint ended, at final estimates, added work included. The average line is the mean of the completed bars, empty sprints included. The burndown shows work left, and lists every scope change under the chart.
Where the charts are
All three live under Reports on a scrum board. Atlassian: “The velocity chart can only be accessed if you’re using the Scrum space template.” What we found on our company-managed board:
| Report | What it shows | Unit |
|---|---|---|
| Velocity report | Commitment and completed per sprint, an average line, a table | Board’s estimation statistic |
| Burndown Chart | Work left in one sprint, a guideline, non-working days, an event table | A statistic picker on the chart (Story Points on ours) |
| Burnup Chart | Work scope, scope projection, completed work and a guideline | The same picker |
| Sprint Report | Completed and not completed work items, * for added work | Board’s estimation statistic |
The unit is your board’s estimation statistic (Board settings, Estimation). Atlassian lists story points, original time, work item count and “Any numeric custom field in your Jira system.” The burndown has its own picker, and Atlassian notes “This change will be saved for you, for when you next visit this chart.”
Every one of them is board-specific: it only includes work items that match the board’s filter, and it judges “done” by the board’s columns, not by the status category.
How Jira calculates velocity
Atlassian defines the two bars:
- Commitment: “the total estimate of all work items in the sprint when it begins. After the sprint has started, any stories added to the sprint, or any changes made to estimates, will not be included in this total.”
- Completed: “the total completed estimates when the sprint ends. Any scope changes made after the sprint started are included in this total.”
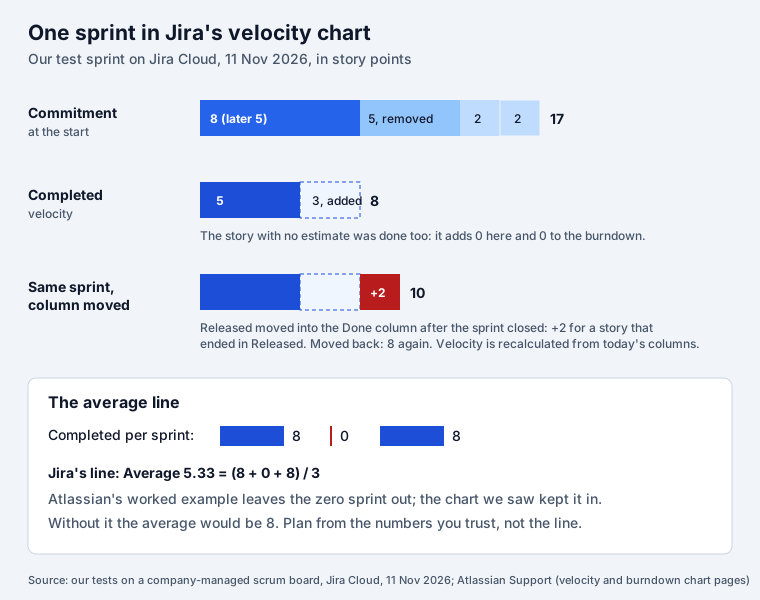
Our sprint showed exactly that. At the start it held five stories: 8, 5, 2 and 2 points, and one with no estimate. During the sprint we re-estimated the 8 to 5, removed the 5-point story, added a new 3-point story and finished it, finished the re-estimated story and the unestimated one, and finished and reopened one of the 2s. The velocity report read 17 committed, 8 completed:
| Work item | In commitment | In completed | Why |
|---|---|---|---|
| Story estimated 8, re-estimated to 5, done | 8 | 5 | Commitment keeps the start value, completed takes the final one |
| Story of 5, removed mid-sprint | 5 | 0 | Removing work does not lower the commitment |
| New story of 3, added and done | 0 | 3 | Added work counts as completed, never as committed |
| Story with no estimate, done | 0 | 0 | Unestimated work is invisible in both bars |
| Story of 2, done then reopened | 2 | 0 | Only the state at the end of the sprint counts |
| Story of 2, ended in Released | 2 | 0 | Released is not the last column (see below) |
Two more rules from Atlassian: “Estimates from sub-tasks are not included in the Velocity Chart’s calculation”, and a work item counts as done only “when it is in a status that has been mapped to the right-most column of your board.”
So a sprint can look like the team committed to 17 and delivered 8, when the plan was cut by 5 on
day one and the team also took on an urgent 3. The sprint report’s * marks and the burndown table
below tell that story; the velocity bars do not.
The average line counts empty sprints
Atlassian’s own worked example computes velocity as “(17.5 + 13.5 + 38.5 + 18 + 33 + 28) / 6 = 24.75 (we’ve ignored the zero story point sprint)”. Our chart did not ignore it:
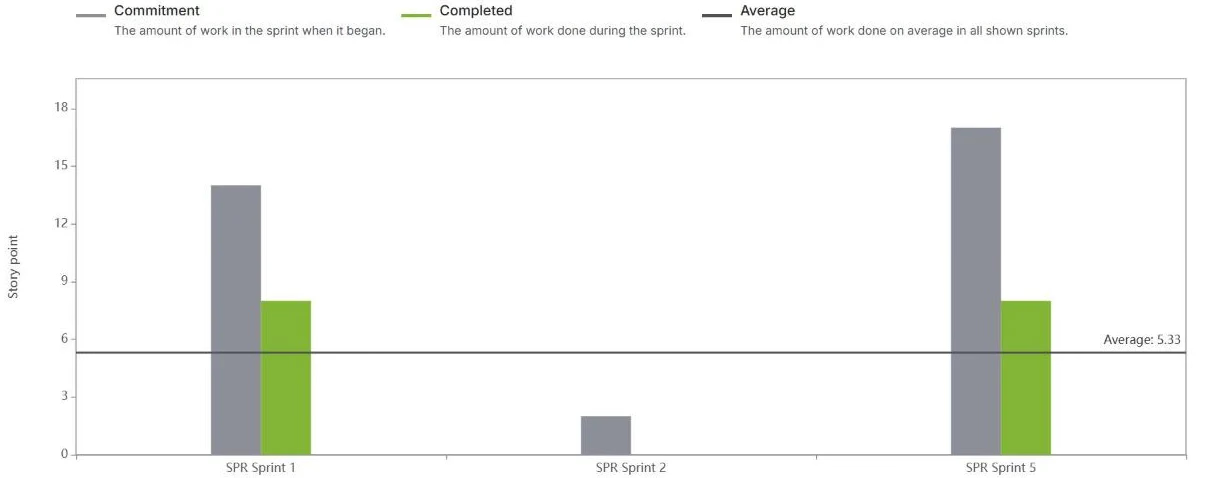
“Average: 5.33” is (8 + 0 + 8) / 3. A sprint that completed nothing, because of a holiday, a mis-mapped column or a sprint closed by mistake, pulls the line down until it scrolls out of the chart. When you plan from velocity, read the completed bars of the last few normal sprints and leave out the ones you know were broken.
A column change rewrites closed sprints
The velocity chart does not store the past. It recalculates every sprint from today’s board columns. We closed a sprint with a 2-point story in Released, a Done-category status that sat in its own column before Done. Completed: 8. Then we dragged Released into the Done column in Board settings. The same closed sprint now showed completed from 8 to 10, and the sprint report moved the story to Completed Issues. We dragged it back, and the chart showed 8 again.
That cuts both ways. If your team finished work in a status that was not in the last column, you can fix the history by mapping that status into the last column. But a board admin who tidies up columns can also change every past sprint, and nobody gets a warning. Take a screenshot of the velocity report before you change a scrum board’s columns.
The start date decides what was committed
Commitment is “the work in the sprint when it began”, and “began” is the sprint’s start date, not the moment someone pressed Start. We started a sprint through the REST API with a start date one minute in the past. Two stories we had added seconds before were now “added after start”: the sprint report marked them as scope change, out of the commitment. We moved the active sprint’s start date to the current minute and both went back into the commitment. Jira recalculated.
Atlassian warns about this in the team-managed docs: “Reports rely on the start date of your sprint to calculate scope, velocity, and burndown.” The start dialog protects you by replacing a planned start date with the current time (we tested that in our sprint post). Scripts and integrations that start sprints do not get that protection.
Read the burndown chart
The burndown shows work left in one sprint: a grey guideline from the starting total to zero, “flat during non-working days”, and a red line for the work left. The part most people skip is the table under the chart, “Sprint scope change event breakdown”. Ours:
Every move of the red line has a row:
| Event Type | Event Detail | What moved the line |
|---|---|---|
| Sprint start | One row per work item, then a Total | The starting point: 17 for us, with - for the unestimated story |
| Scope change | “Estimate changed from 8 to 5” | Down 3. A re-estimate looks like progress on the chart |
| Scope change | “Issue removed from sprint” | Down 5. Cutting scope looks like progress too |
| Scope change | “Issue added to sprint” | Up by its estimate; our story was done within a second and showed 0 |
| Burndown | “Issue completed” | Down by its estimate; 0 for the unestimated story |
| Burndown | “Issue reopened” | Back up |
Moving a story to Released (not the last column) created no row: for the burndown it was still work left. And when we started a sprint empty and added three stories seconds later, the chart had no guideline at all, only a red line rising from 0 to 7. Atlassian describes the cause: “the sprint may have been started before any work items were assigned to it.”
The red line falling is not the same as work getting done. On our chart 8 of the 13 points that left the line were a re-estimate and a removed story.
Burndown vs burnup
A burnup draws what the burndown hides. Our company-managed board offered a Burnup Chart with four series: Work scope, Scope projection, Completed Work and a Guideline. On the sprint above it showed scope falling from 17 to 12 while completed work climbed to 10 and dropped back to 8 when the story was reopened.
| Question | Burndown | Burnup |
|---|---|---|
| Will we finish the sprint? | Red line against the guideline | Completed line against the scope line |
| Did scope change? | Only in the event table | A separate scope line you can see |
| Was work re-estimated or removed? | Looks like progress | The scope line drops, completed does not move |
| Best for | A daily glance at stand-up | Sprint reviews and stakeholders |
Velocity and burndown on a dashboard
The built-in dashboard gadgets cover the burndown, not velocity. In our test of Jira’s dashboard gadgets the sprint gadgets were Sprint burndown (“Chart remaining work in a sprint”) and Sprint health. For velocity, link the report from a text gadget, or pick an app.
Plan the next sprint from velocity
Velocity forecasts what a team with the same people and the same habits will finish. Three habits make it worth reading:
- Keep the board’s last column right. Every status that means finished goes in the last column. Check it before the sprint, not after.
- Estimate everything that enters a sprint, at the story level. Unestimated work and sub-task estimates do not exist for these charts.
- Adjust for who is there. Velocity assumes a full team. The free sprint capacity calculator scales a velocity by the hours people actually have after leave and holidays, and the story points to hours calculator turns velocity into a range of hours for a conversation with someone who thinks in days.
Our Workload & Capacity Planner for Jira shows each person’s remaining estimate hours per week against their capacity, with a Sprints view to move work between sprints before you start one. It does not draw velocity or burndown charts; it helps you avoid committing to work nobody has time for. How starting, completing and deleting sprints work, and where unfinished work goes: Jira sprints, tested.
How we tested
Jira Cloud site, 11 November 2026, signed in as a site admin. A company-managed scrum space with a
simplified workflow and a Released column (Done category) before Done, story points as the board’s
estimate. We ran three sprints whose numbers appear here, changed estimates and scope through the
REST API (/rest/api/3/issue, /rest/agile/1.0/sprint), and read the velocity report, the burndown
chart with its event table, the burnup chart and the sprint report in the browser and from the data
behind them. Atlassian’s pages were read the same day: View and understand the velocity
chart,
View and understand the burndown
chart,
View and understand the sprint
report
and Enable sprints.
Frequently asked questions
How does Jira calculate velocity?
For each completed sprint Jira shows two numbers. Commitment is the total estimate of the work items in the sprint when it started; work added later and later re-estimates do not change it. Completed is the total estimate of the work items in the board's last column when the sprint ended, at their final estimates, including work added after the start. Velocity is the average of the completed numbers over the sprints shown. In our test a sprint read 17 committed and 8 completed.
Why does my Jira velocity chart look wrong?
The usual causes: work finished in a status that is not in the board's last column (it counts as not done), work with no estimate (it counts as 0), estimates on sub-tasks (ignored), a sprint start date set before the work was added (the work becomes scope change), and a later change to the board's columns, which recalculates closed sprints. The average line also includes sprints that completed nothing.
Can I add a velocity chart to a Jira dashboard?
Not with a built-in gadget. Among the built-in gadgets we listed for our dashboard post, the sprint ones are Sprint burndown ("Chart remaining work in a sprint") and Sprint health. For velocity on a dashboard, link the velocity report from a text gadget or use a Marketplace app.
What is the difference between a burndown and a burnup chart in Jira?
A burndown shows the work left in a sprint going down to zero; scope added or removed moves the same line, so a flat line can mean progress cancelled out by new work. A burnup draws two lines, work completed going up and the total scope, so scope creep is visible as its own line. On our company-managed board both were available under Reports.
Why is there no guideline in my Jira burndown chart?
Usually because the sprint started before any work was in it. Atlassian says "the sprint may have been started before any work items were assigned to it". We started an empty sprint and added three stories three seconds later: the burndown showed the red line rising from 0 to 7 and no grey guideline at all.
Are sub-tasks included in Jira velocity?
No. Atlassian: "Estimates from sub-tasks are not included in the Velocity Chart's calculation." The burndown chart ignores story points on sub-tasks too. Estimate the parent story, or estimate in time with time tracking, where sub-task hours roll up to the parent.
Keep reading
- Jira, JSM and the Marketplace · 13 minJira Sprints: Start, Complete and What Counts, Tested
- Jira, JSM and the Marketplace · 11 minJira Labels vs Components: When to Use Each, Tested
- Jira, JSM and the Marketplace · 8 minJira Timeline: Why Bars Are Missing and What It Shows
- Free toolSprint capacity calculator