Jira Cycle Time: How the Control Chart Counts It, Tested
On this page
The retro slide says “average cycle time: 2 days”. Someone asks what that covers. Does it start when the ticket is created or when someone picks it up? Does the week it sat in review count? What about the bug that was reopened twice? Nobody in the room knows, because Jira does the sum out of sight.
We moved eight test work items through a real Jira Cloud board on 14 November 2026, each with a different path, and read what the control chart made of them. Then we recomputed every number by hand from the board’s own data.
Short answer: In Jira, cycle time usually means the Control Chart (Reports, Control Chart, on a company-managed board). It adds up the time each work item spent in the columns you tick under Refine report, by default the ones between your first and last column. Time outside them does not count, even mid-way, and a reopened item adds both stints. Add the To Do column and the same chart shows lead time. Two other places use the name for different numbers: the space insights dashboard (wall-clock time from the first move to In Progress until resolved) and the DevOps Cycle time report (from first commit to production deployment, CI/CD needed). On one board, for the same test items, the three gave 0, 3.3 minutes and nothing at all.
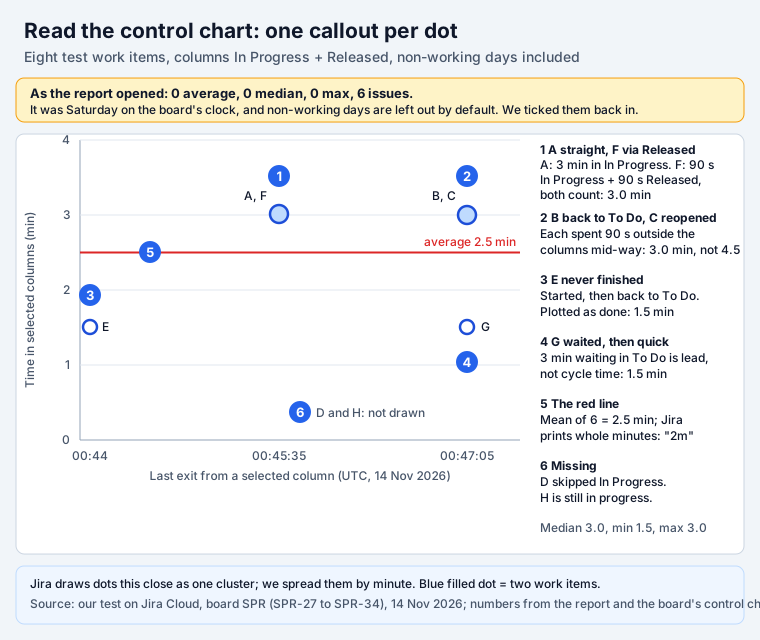
Read the chart, callout by callout
Atlassian’s control chart page explains the parts. Here is each one on our eight items, with the rule it follows.
- A dot’s height is the time in the selected columns. Atlassian: “The control chart shows the cycle time (or lead time) for your product, version, or sprint. It takes the time spent by each work item in a particular status (or statuses)”. Our board has a Released column between In Progress and Done, and Jira ticked it by default with In Progress. So SPR-32 (F), with 90 seconds in each, counts 3.0 minutes, the same as SPR-27 (A) with 3 minutes in In Progress alone.
- Time outside the columns vanishes, even in the middle. SPR-28 (B) went back to To Do for 90 seconds, then on to Done. SPR-29 (C) went to Done, was reopened, and went to Done again. Both show 3.0 minutes. From first start to finish, each took 4.5 min. Reopened work does add up, as Atlassian says: “if a work item is reopened, worked on, and completed again, then the time for this extra work is added to the cycle time.”
- An abandoned item counts as finished. SPR-31 (E) was started and dropped back to To Do. It has no resolution and is not done, yet it sits on the chart at 1.5 minutes. Atlassian’s Tip 3 warns about this: “The Control Chart shows data for work items that have been in a selected column, but are no longer in a selected column … by default, this will include work items that are still moving across the board.”
- Waiting before the start is not cycle time. SPR-33 (G) sat in To Do for 3 minutes, then took 1.5. Cycle time 1.5 minutes. Tick To Do as well and the chart turns into lead time: 4.5.
- The red line is the plain average. 15.03 minutes over 6 items is 2.5. The report printed “2m average”, and the cluster said “Min time 1m” for 1.5: it shows whole minutes and drops the rest.
- Some work never appears. SPR-30 (D) went from To Do straight to Done, so it never entered a selected column. SPR-34 (H) is still in progress, so it has not left one. Neither is drawn. Six dots, eight work items.
The horizontal position is the moment the item last left a selected column: “The horizontal placement indicates when the work item transitioned out of the last status selected on the chart”. For C that is the second time it left In Progress, not the first.
The Saturday that counted as zero
When we opened the report it read “0 average 0 median 0 min time 0 max time 6 issues”. Every item at zero. The board’s chart data showed why: its working-time calendar runs in the Pacific/Auckland time zone, and the test ran on Saturday afternoon there. Atlassian lists the Control Chart among the reports that use the board’s working days, and the report’s Include non-working days in calculations box is off by default. With it ticked, the same six items read “2m average 3m median 1m min time 3m max time”.
So a hotfix done over a weekend, or on a public holiday you added to the board, costs nothing on this chart. Check the board’s region and time zone before you compare teams; our post on Jira holidays shows where those settings live.
By hand: recompute the control chart
The report page loads one data file per board with three numbers per work item and column: total time, working time and the last time the item left that column. We saved it and redid the sums. The times below are from the work items’ changelogs, rounded to the second.
| Work item | Path | In Progress | Released | Control chart (cycle) | Start to finish (Kanban Guide) | Lead time (To Do ticked) |
|---|---|---|---|---|---|---|
| SPR-27 A | To Do, In Progress, Done | 180 s | 0 | 3.01 min | 3.01 min | 3.12 min |
| SPR-28 B | In Progress, back to To Do, In Progress, Done | 180 s | 0 | 3.00 min | 4.50 min | 4.60 min |
| SPR-29 C | In Progress, Done, reopened, Done | 180 s | 0 | 3.00 min | 4.50 min | 3.08 min |
| SPR-30 D | To Do straight to Done | 0 | 0 | not drawn | none | 0.07 min |
| SPR-31 E | In Progress, back to To Do, left there | 90 s | 0 | 1.51 min | not finished | not drawn (in To Do) |
| SPR-32 F | In Progress, Released, Done | 90 s | 90 s | 3.01 min | 3.01 min | 3.05 min |
| SPR-33 G | waits 3 min in To Do, In Progress, Done | 90 s | 0 | 1.50 min | 1.50 min | 4.54 min |
| SPR-34 H | In Progress, left there | 284 s so far | 0 | not drawn | not finished | not drawn |
The steps, so you can redo them on your own board:
- Pick the columns. Cycle time: In Progress and Released (Jira’s default here). Lead time: add To Do.
- Keep the work items that have left them. An item still in a ticked column is skipped (H). An item that never entered one is skipped (D). Everything else counts, finished or not (E).
- Add up each item’s time in the ticked columns. Every stay counts, so reopened work adds up (C).
- Statistics. Six values: 3.01, 3.00, 3.00, 1.51, 3.01, 1.50. Average 2.5, median 3.0, minimum 1.5, maximum 3.0. Our sums matched the six work item keys and the median and maximum the report printed; the report rounds the rest down to whole minutes.
- Rolling average. Atlassian: “20% of the total work items displayed (always an odd number and a minimum of 5 work items) is used in the calculation.” 20 % of 6 is 1.2, so the window is 5, and the legend said “5 issue window”. Sorted by exit time the items run E, A, F, C, B, G. For F, the third, the window is two before and two after: (1.51 + 3.01 + 3.01 + 3.00 + 3.00) / 5 = 2.71 minutes.
- Spread. The blue band is the standard deviation around the rolling average. On our six values the plain standard deviation is 0.71 minutes (population formula), a band about as wide as the gap between the two groups of dots.
Atlassian explains why the window counts work items and not days in Methods of calculating rolling average: a time window lets one late outlier drag the line up, while an item window “clearly shows the last work item as an outlier with the appropriate standard deviation.”
Three things Jira calls cycle time
The same test items, the same board, the same morning. Three numbers.
| Where | What it measures | Working days | Our six items |
|---|---|---|---|
| Reports, More reports, Control Chart | time in the columns you tick | left out by default | 0 as opened; 2.5 min with them ticked |
| Reports, space insights, Work item cycle time chart | wall-clock time from the first move to In Progress until resolved (our recomputation) | ignored | 197.8 seconds (3.3 min) |
| Reports, More reports, Cycle Time Report (DevOps) | first commit to the last production deployment | not stated | “No week median / More data required” |
The space insights chart is the one on the dashboard that opens first under Reports. Atlassian does not document its rule. Five of our items had been through In Progress and were resolved that day; from the first move to In Progress to the resolution date they took 180, 270, 270, 180 and 90 seconds, an average of 198.1. The chart said 197.8. So it counts B and C at 4.5 minutes where the control chart counts 3, and it counted our Saturday in full. Its Work item lead time chart showed the same 197.8 under the same axis label, “Average work item cycle time (seconds)”.
The DevOps report is a different measure. Atlassian’s cycle time report page, the top Google result for “jira cycle time”, says: “we’re measuring a work item’s cycle time from the first commit until the code is shipped.” It needs “deployment events from your CI/CD tool and commit events from your source code management tool”, and work item keys in branches, commits and pull requests. It shows “the median cycle time of one week compared to the 12 weeks prior”. Without a pipeline connected it stays empty, as ours did.
When a slide says “cycle time”, ask which of the three it is. The difference is not rounding.
The moves that change the number
| What happens to a work item | What the control chart does | What to do |
|---|---|---|
| Goes back to To Do, then on | drops the time in To Do (B: 3.0, not 4.5 min) | fine for “time worked”; use start to finish for a delivery promise |
| Reopened after Done | adds both stints, drops the time in Done (C) | find them: status CHANGED FROM Done in a quick filter or search |
| Skips In Progress | never drawn (D) | make In Progress part of the workflow, or the item is invisible |
| Started, then abandoned in To Do | drawn as finished with its partial time (E) | Atlassian’s quick filter for finished work: status in (Resolved, Closed) |
| Still in progress | not drawn until it leaves (H) | watch its age separately (see below) |
| Waits in the backlog | not cycle time (G) | tick To Do for lead time |
| Sits in a Done-category column like Released | counts if the column is ticked (F) | untick it if Released means “waiting for the train” |
| Moves on a weekend or a board holiday | counts 0 by default | tick Include non-working days, check the board’s time zone |
| Closed as duplicate or won’t do | counts like real work | Atlassian’s quick filter: resolution in (Fixed) |
Atlassian’s own fixes for outliers come from the same page. For a story “that was started but
stopped, then eventually dropped back to the backlog”, it suggests a label and the quick filter
labels is EMPTY or labels not in (outlier). For triage casualties it suggests resolution in (Fixed), because “work items that are triaged and resolved as a duplicate, answered, tracked
elsewhere, etc can skew the data”. Quick filters are board settings, so a board admin adds them.
To list the items that went backwards on your own board, JQL history searches help:
project = SPR AND status CHANGED FROM "In Progress" TO "To Do" returned exactly SPR-28 (B) and
SPR-31 (E) on our board, and status CHANGED FROM Done on the test items returned SPR-29 (C). How CHANGED and WAS
behave is tested in JQL history: WAS and CHANGED.
Cycle time vs lead time in Jira
The Kanban Guide defines cycle time as “The elapsed time between when a work item started and when a work item finished.” That is a stopwatch: start it once, stop it once. Jira’s control chart is closer to a time sheet of columns. Atlassian’s wording: “Cycle time is the time spent working on a work item”. Lead time is “the time taken from when a work item is logged (not when work begins) until work is completed”.
| Measure | Starts | Stops | In Jira |
|---|---|---|---|
| Cycle time (Kanban Guide) | first start | finish | space insights is closest |
| Cycle time (Jira) | each entry to a ticked column | each exit | Control Chart, In Progress and later ticked |
| Lead time (Jira) | created | done | Control Chart, To Do ticked too |
| Work item age (Kanban Guide) | first start | now | not a built-in report |
For most teams the two cycle times match. They split when work goes backwards, which is the work you most want to see.
What to put on the retro slide
- Name the columns. “Cycle time, In Progress to Released, working days only” is a number someone can check. “Cycle time” alone is not.
- Prefer the median and a percentile to the average. The Kanban Guide’s service level expectation is a percentile: “85% of work items will be finished in eight days or less”. The control chart prints average, median, minimum and maximum, and a request for 85th and 95th percentiles (JSWCLOUD-15616) was closed as Won’t Fix.
- Filter out the noise first. Abandoned work (E) and triage closes pull the average down.
- Look at the timeframe and the scale. If the longest item is 30 days or more, Atlassian switches the vertical axis to “a cube-root power scale”, which makes outliers look closer than they are.
- Use the same chart every time. The space insights chart and the control chart differ by design; a trend built from one and then the other is not a trend.
The status categories decide what “done” means in most other reports; the control chart ignores them and goes by the columns you tick, which is why a Done-category column like Released can still count as work.
What Jira does not give you
The gaps are long-standing. Votes from Atlassian’s public tracker, read on 14 November 2026:
| Request | Votes | Status |
|---|---|---|
| JRACLOUD-90221 Report for time in status | 243 | Gathering interest |
| JRACLOUD-94942 Cycle time gadget for dashboards | 241 | Gathering interest |
| JRACLOUD-94952 Control Chart and CFD as gadgets | 146 | Gathering interest |
| JRACLOUD-90113 Control chart for team-managed spaces | 143 | Gathering interest |
| JRACLOUD-86825 Cycle time per column in team-managed spaces | 122 | Gathering interest |
| JRACLOUD-87850 Export cycle time data from the control chart | 74 | Gathering interest |
No dashboard gadget, no export, no team-managed version and no percentiles. That is why page 1 for “jira cycle time” is mostly app vendors. If you only need the numbers once, the by-hand method above works with the changelog of each work item.
Where our app fits
The control chart looks back at finished work. The work you can still save is the work in progress, and Jira has no built-in chart of its age. Our Kanban Status Board shows on every card in progress how many days it has spent in its current status, all stays added up. The count turns amber past what half of the project’s recently finished issues took in that status and red past what 85 % took, the Kanban Guide’s percentile idea applied before the item is late. Its Flow metrics button opens a WIP aging chart and weekly throughput for the last 12 weeks. It does not draw a control chart, a cycle time report or a cumulative flow diagram; for those, Jira’s own reports are the place. Which built-in report answers which question is in Jira reports, 21 examples, and how WIP limits and the board columns behave is in Jira kanban board, tested.
How we tested
Site: simplify-demo.atlassian.net, Jira Cloud Standard, space SPR (company-managed scrum, board columns To Do, In Progress, Released, Done). 14 November 2026, in a signed-in browser.
- Test data: eight Tasks with the label
cycle-test, SPR-27 to SPR-34, not in a sprint. Each path ran on a 90-second step through the REST transition endpoint, starting at 00:42:31 UTC. All 19 moves returned success. - Control chart: opened Reports, Control Chart, read the summary line with the default settings, then with Include non-working days in calculations ticked (a view option), and the cluster’s work item list.
- Recomputation: the chart’s own data file for board SPR (total time, working time and last exit per column), and each work item’s changelog through the REST API.
- Space insights and the DevOps report: read on the same space after the test.
We changed no site, space or board settings. Atlassian pages were fetched on 14 November 2026. Sources: Control chart, Rolling average methods, Cycle time report, Configure working days, Kanban Guide.
Frequently asked questions
What is the difference between cycle time and lead time in Jira?
Both come from the same control chart. Cycle time is the time a work item spent in the columns you select as work, usually In Progress and review. Lead time is the same sum with the waiting column added, from when the work item was logged until it is done. In Jira you switch between them by ticking columns under Refine report, Columns. On our test board the item that waited 3 minutes in To Do had a cycle time of 1.5 minutes and a lead time of 4.5.
Is there a cycle time gadget for Jira dashboards?
Not a built-in one. The suggestion for a cycle time gadget (JRACLOUD-94942) has 241 votes and has been gathering interest since 2013, and the request to make the Control Chart a gadget (JRACLOUD-94952) has 146. Today you open the report from the board, use the cycle time chart on the space insights dashboard, or install an app.
Can I see cycle time in a team-managed space?
Not with the control chart. Atlassian says the page "applies to company-managed spaces only", and the suggestion for a team-managed control chart (JRACLOUD-90113, 143 votes) is still gathering interest. A team-managed space can add the Reports tab, which offers burnup, velocity, sprint burndown and the cumulative flow diagram.
Can I export the control chart data?
There is no export button. The request (JRACLOUD-87850) has been open since 2012 with 74 votes. Two workarounds: select a cluster dot and use View in Issue Navigator to get its work items as a list, or export the list of work items and compute the time from each changelog yourself, as we do in this post.
What do the rolling average and the blue band mean on the control chart?
The blue line is the rolling average: for each dot Jira averages that work item and the same number of items before and after it, a window of 20 % of the items shown, odd, at least 5. The blue band is the standard deviation, the spread around that line. A narrow band means the next item will probably take about as long as the line says.
Why does my control chart show 0 or nothing at all?
Three causes we hit. Non-working days are left out by default, so work done on a weekend in the board's time zone counts as 0; tick Include non-working days in calculations. A work item still sitting in a selected column is not drawn yet. And an item that never entered a selected column, such as one moved from To Do straight to Done, never appears.
Does the Jira control chart show percentiles such as the 85th?
No. It shows the average, median, minimum and maximum, the rolling average and the standard deviation. A request for 25/75/85/95/99 % percentiles (JSWCLOUD-15616) was closed as Won't Fix. The Kanban Guide states a service level expectation as a percentile, for example 85 % of items finished in eight days, so you have to work it out yourself or use an app.