Jira Dashboard: 33 Built-in Gadgets, Tested on a Real Site
On this page
Monday’s stand-up opens the team dashboard. “Resolved this month: 3.” The board on the next tab shows seven requests in Resolved. Both are right: the board counts a status, the gadget counts a field. A dashboard is only as honest as the gadgets on it and the data under them.
We read the full gadget list of our Jira Cloud site on 5 November 2026, built a test dashboard with six of the built-in gadgets, and compared what each one showed with what the data said.
Short answer: a Jira dashboard is a page of gadgets. Each gadget reads a space or a saved filter and shows it as a list, a table or a chart. A board is different: you move work there; on a dashboard you only look. Our site offered 37 gadgets, 33 of them built in. Six of those count on the Resolution field, so if your workflow reaches Done without setting a Resolution, those six report less work finished than your board shows.
Creating one takes two minutes
- Open Dashboards and create a dashboard: a name, and who can see and edit it. Ours, “Blog test: PAY team dashboard”, is private.
- Select Edit. Jira shows “You are currently editing your dashboard. Changes will be saved automatically.”
- Select Add gadget. The panel lists every gadget with filters: on our site All 37, Jira 30, Wallboard 5, Charts 12, Jira Service Management 2.
- Each new gadget asks for its source. Most take a project or saved filter; Filter results takes a saved filter only; Sprint health reads a sprint on a board.
- Use Change layout for columns, drag gadgets into place, and select Done.
The work is in step 4. A gadget is only a view of a filter, so a sloppy filter makes a sloppy chart. Save the JQL once (“Team X, open work”) and point several gadgets at it.
Every built-in gadget, and what it reads
From our site’s gadget list (the descriptions are Jira’s own) and Atlassian’s gadget reference. “Resolution” marks the gadgets whose numbers depend on the Resolution field.
| Group | Gadget | What it shows | Resolution |
|---|---|---|---|
| Lists | Assigned to me | “List unresolved work items assigned to you” | yes |
| Lists | Issues in progress | “List work items in progress” | |
| Lists | Filter results | “List work items matching a saved filter”, columns you pick | |
| Lists | Watched issues, Voted work items | work items you watch or voted for | |
| Lists | Starred filters, Quick links | your starred filters; links for common tasks | |
| Lists | Spaces, Labels gadget | spaces with their filters; a space’s labels | |
| Lists | Jira road map | “Display upcoming versions for specified spaces” | |
| Lists | Jira issues calendar | work items and versions by due date | |
| Lists | Activity stream, Introduction | recent activity; a welcome message | |
| Statistics | Work item statistics | a filter broken down by one field | |
| Statistics | Two dimensional filter statistics | a table: one field against another, such as status by assignee | |
| Statistics | Pie chart, Workload pie chart | a filter grouped by a field, as a pie | |
| Statistics | Heat map, Bubble Chart | a field as a heat map; work items in four dimensions | |
| Time charts | Created vs. resolved chart | “Compare created and resolved work items” | yes |
| Time charts | Resolution time | “Chart time taken to resolve work items” | yes |
| Time charts | Average age chart | “Display average age of unresolved work items” | yes |
| Time charts | Recently created chart | creation rate, and how many of those were resolved | yes |
| Time charts | Average time in status | “Display resolved items’ average time per status” | yes |
| Time charts | Average number of times in status | “Display average entries into each status” | |
| Time charts | Time since chart | “Chart elapsed time from a chosen field” (Resolved is one choice) | if chosen |
| Sprint | Sprint health gadget | “Display a snapshot of sprint health” | |
| Sprint | Sprint burndown gadget | “Chart remaining work in a sprint” | |
| Sprint | Days remaining in sprint gadget | days left in a sprint | |
| Service desk | Time to first response | “Display first response times in hours” | |
| Service desk | Filter counts, Service project report | counts for your criteria; a report from a service space | |
| Layout | Wallboard Spacer Gadget | space between gadgets on a wallboard |
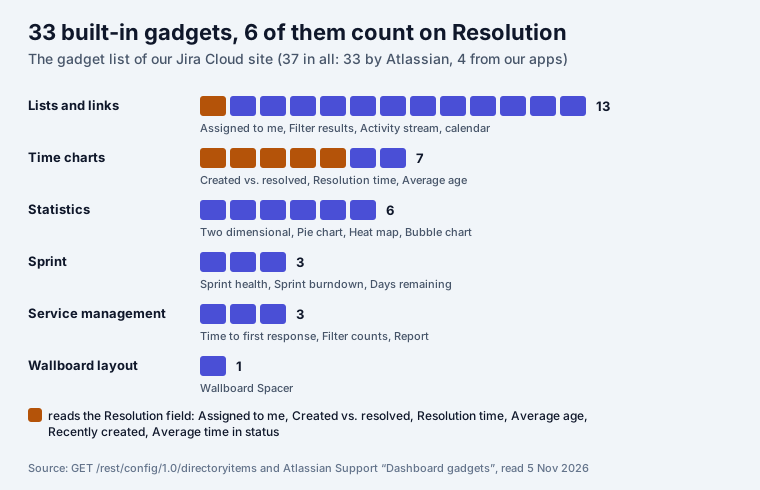
What our test dashboard showed
Six gadgets, two spaces. The top row is the one that matters:
- Created vs. resolved: “Created issues (15)”, “Resolved issues (3)”. At that moment seven help desk requests were in the Resolved status. Four had no Resolution, so the gadget counted them as open. Our Jira workflow guide shows why the workflow did that and the two JQL checks that find it.
- Two dimensional filter statistics (status by assignee) gave the most useful single view: 29 work items, 16 of them in To Do, six of those with Sophia Martinez. It reads statuses, not the Resolution, so it agreed with the board.
- Sprint health said “No estimated issues (Story Points)”, “0 days left” and “100 % time elapsed”. Sprint 14 had ended on 25 October and nobody had closed it, and the gadget found no work item in it estimated in Story Points. A gadget cannot fix either; it just makes them visible.
- Average time in status stays empty until items are resolved: in the gadget’s own words it covers “all resolved issues over the past 90 days.”
Five dashboards worth building
| Dashboard | For | Gadgets | Watch out |
|---|---|---|---|
| Team today | the daily stand-up | Two dimensional filter statistics (status by assignee), Filter results, Sprint health | an open sprint past its end date |
| Help desk | agents and leads | Time to first response, Filter counts, Created vs. resolved | requests resolved without a Resolution |
| Weekly flow | the manager | Created vs. resolved, Resolution time, Average age chart | all three read the Resolution field |
| Release | product | Jira road map, Pie chart by fix version, Filter results for the version | only versions due within the period you set |
| My work | everyone | Assigned to me, Watched issues, Activity stream | Assigned to me hides items with a Resolution |
Rule of thumb: one dashboard per question, five or six gadgets, all pointing at saved filters you own. Ten gadgets that each run their own JQL become ten places to fix when the team changes.
Wallboards
From Atlassian: “A wallboard is full-screen display of a dashboard. It hides any navigation menus and rotates through the gadgets of the dashboard.” “Gadgets with the same highlight color in a column are grouped and shown one at a time.” A wallboard slide show rotates several dashboards; “The default is 30 seconds”, and “you can only configure one wallboard slide show.” A wallboard mirrors its dashboard, so deleting the dashboard deletes the wallboard too.
Boards on a dashboard
Jira’s gadgets summarise; none of them shows the work as columns you can scan at a glance. Each of our ticket boards adds a dashboard gadget that does. This is the “Payments Platform overview” dashboard on our test site with two of them:
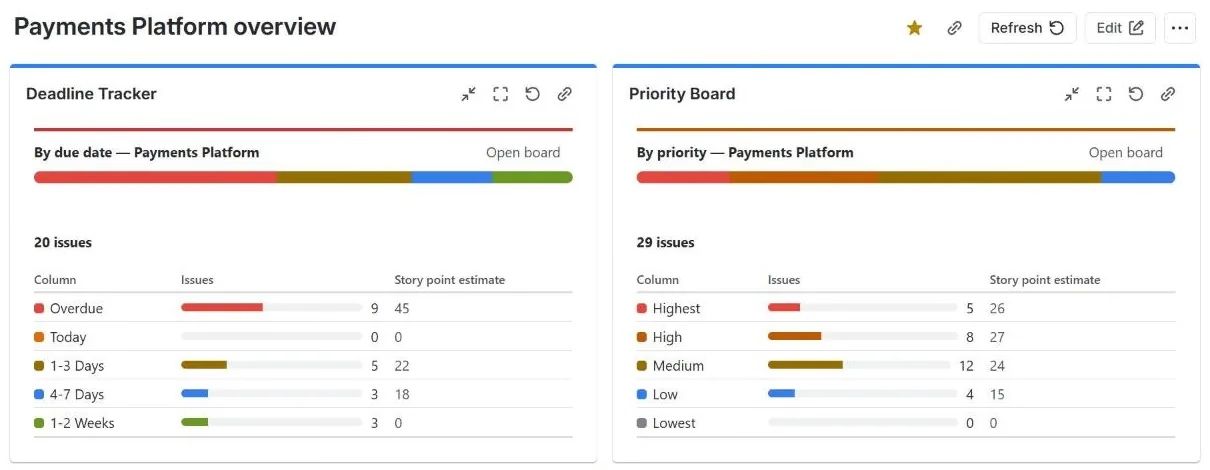
- Deadline Tracker: columns from Overdue to two weeks out. On our site 9 of 20 dated work items were overdue, which no built-in gadget shows as plainly.
- Priority Board: work items per priority, with sums.
- Kanban Status Board: work items per status, one board per shared workflow.
- Workload & Capacity Planner: work items per person, with sums.
Each gadget shows its board’s columns with counts and a sum such as story points, and opens the full board where cards can be dragged. All four are free for up to 10 users. If the dashboard is for a status meeting, our guide to the Jira status report covers what to put around the numbers. Why finished work drops off a kanban board after 14 days, so a dashboard is the place for history, is in our Jira kanban board guide.
Sources
- Our Jira Cloud site, 5 November 2026: the gadget directory (
/rest/config/1.0/directoryitems), a test dashboard built through the dashboard REST API, the Add a Gadget panel, and the existing Payments Platform overview dashboard. - Atlassian Support: Dashboard gadgets, Set up a wallboard.
- Atlassian knowledge base: Best practices on using the “Resolution” field in Jira Cloud.
Frequently asked questions
What is a Jira dashboard?
A page of gadgets. Atlassian: "Gadgets display summaries of Jira space and work item data on the dashboard." Each gadget reads a space or a saved filter and shows it as a list, a table or a chart. Every site has a default dashboard, and people can create more, private or shared.
What is the difference between a Jira board and a Jira dashboard?
A board is where you work: work items as cards in columns, and moving a card changes the item. A dashboard is where you look: gadgets that summarise work items from one or more spaces, and nothing on it moves work. Jira can show a sprint's health or a filter on a dashboard, but not a draggable board, unless an app adds one as a gadget.
How do I create a dashboard in Jira?
Open Dashboards, create a dashboard, give it a name and choose who can see it. Select Edit, then Add gadget, pick gadgets from the panel (our site offered 37) and fill in each one's settings, usually a space or saved filter. In edit mode Jira says "Changes will be saved automatically"; select Done when finished.
Why does Created vs Resolved show fewer resolved work items than my board?
Because it counts the Resolution field, not the status. On our test site the help desk had 7 requests in the Resolved status, but only 3 had a Resolution, and the gadget showed "Resolved issues (3)". Check with the JQL statusCategory = Done AND resolution IS EMPTY and fix the workflow so the transition to Done sets a Resolution.
How many gadgets does Jira have?
Our Jira Cloud site with Jira, Jira Service Management and Confluence listed 37 gadgets: 33 by Atlassian and 4 from apps we had installed. The panel's filters read All 37, Jira 30, Wallboard 5, Charts 12 and Jira Service Management 2. More come with Marketplace apps.
What is a Jira wallboard?
A dashboard shown full screen for a TV. Atlassian: it "hides any navigation menus and rotates through the gadgets of the dashboard." Gadgets with the same highlight colour in a column take turns. A wallboard slide show rotates whole dashboards every 30 seconds by default, and there is only one slide show.
Keep reading
- Jira, JSM and the Marketplace · 11 minDeveloper Burnout: 2026 Research, Causes and Warning Signs
- Jira, JSM and the Marketplace · 18 minJira Deadlines: Due Date JQL, Reminders, the Day Rule (2026)
- Jira, JSM and the Marketplace · 8 minJira Status Report: Weekly Template and 6 Tested JQL Queries
- Free toolBusiness days calculator