Developer Burnout: 2026 Research, Causes and Warning Signs
On this page
It is the Monday after a release. Two people on the team have taken sick days, the senior engineer says “fine” to everything in stand-up, and the sprint was replanned twice last week because the roadmap changed. Nobody would call it burnout yet. The research says that is exactly how it starts.
There are dozens of “developer burnout statistics” pages, and most repeat the same five numbers without saying where they come from. We went back to the primary sources: the WHO definition, JetBrains’ 2023 and 2025 developer surveys, Google’s DORA 2024 report, Haystack Analytics’ 2021 study and a 2023 systematic mapping study. Here is what each one actually measured, which popular numbers we could not trace, and what the evidence says a team can do.
Short answer: burnout is common in software, and how common depends on the question. 73% of 26,348 developers in JetBrains’ 2023 survey “have experienced burnout in their career”; in its 2025 survey the burnout rate was 61% for developers with 1 to 2 years of experience and 38% for those with 16 or more. The best-supported cause is the work environment, above all unstable priorities: DORA 2024 found they bring “substantial increases in burnout” that good leaders, documentation and a user focus could not offset. The fix it recommends is to stabilize priorities and shield people from the churn.
What burnout is, and what it is not
The World Health Organization added burn-out to the ICD-11 as an occupational phenomenon. Its definition, word for word: “Burn-out is a syndrome conceptualized as resulting from chronic workplace stress that has not been successfully managed.” It has three dimensions:
- “feelings of energy depletion or exhaustion”;
- “increased mental distance from one’s job, or feelings of negativism or cynicism related to one’s job”;
- “reduced professional efficacy”.
Two more lines from the WHO matter for anyone writing about it. Burn-out “refers specifically to phenomena in the occupational context and should not be applied to describe experiences in other areas of life”, and “It is not classified as a medical condition.” So burnout is about the job, and it is not a diagnosis a dashboard can make.
In a developer’s week the three dimensions look familiar. Exhaustion is the late nights before a release that never quite end. Distance is the engineer who stops arguing in design reviews because “it will change again anyway”. Reduced efficacy is the feeling that a day of meetings, reviews and interruptions produced nothing, even when the board says otherwise.
DORA’s 2024 report uses a close definition, “a state of emotional, physical, and mental exhaustion caused by prolonged or excessive stress, often characterized by feelings of cynicism, detachment, and a lack of accomplishment”, and measures it as a factor covering “physical, emotional, and psychological dimensions, as well as its impact on personal life”.
How common is it? Each number answers a different question
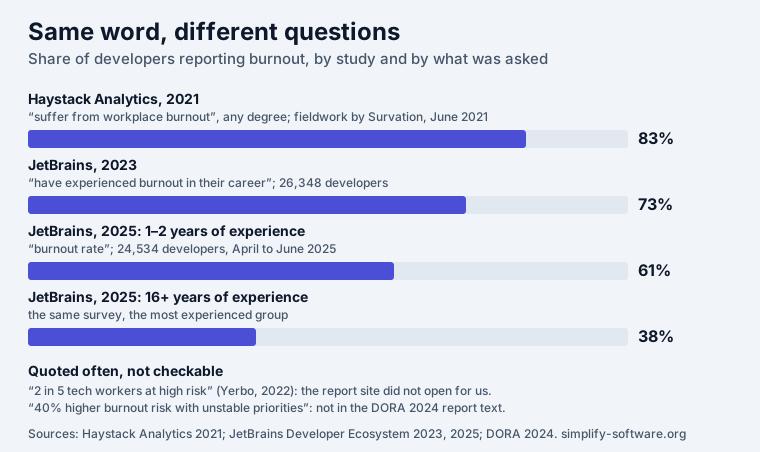
The headline numbers are not comparable, and the difference is in the wording:
- “Ever, in your career.” JetBrains’ State of Developer Ecosystem 2023 surveyed 26,348 developers: “73% of developers have experienced burnout in their career.” That is a lifetime figure; it says little about this quarter.
- “Right now, any degree.” Haystack Analytics’ 2021 study found “83% of software developers suffer from workplace burnout”. The fieldwork was done by the research agency Survation in June 2021, in the middle of the pandemic, and the figure counts mild burnout too.
- “By experience.” JetBrains’ 2025 survey (24,534 developers, April to June 2025) reports a burnout rate of 61% for developers with 1 to 2 years of experience and 38% for those with 16 or more. Juniors report it far more often, which runs against the image of the burned-out veteran.
Two cautions about every survey here. JetBrains says of its own sample: “Some bias may remain, as JetBrains users could have been more likely to respond.” And none of these surveys follows the same people over time, so they show how many people say they are or were burned out, not why.
The same 2025 survey has one more number worth knowing if you run a small company: the share of developers whose employer offers mental health support was 11% in small organizations, 23% in medium ones and 47% in large ones.
Fact check: the numbers you will see quoted
We traced the figures that “developer burnout statistics” pages repeat most. Where the primary source says something different, we say so.
| Quoted number | Where it comes from | What the primary source says | Verdict |
|---|---|---|---|
| 83% of developers suffer from burnout | Haystack Analytics, July 2021 | “83% of software developers suffer from workplace burnout”; fieldwork by Survation, June 2021; sample size not given in the release | real, but any degree and pandemic-era |
| 73% of developers have experienced burnout | JetBrains, Developer Ecosystem 2023 | “73% of developers have experienced burnout in their career”; 26,348 developers | real; a career figure, not a current one |
| 61% of junior developers are burned out | JetBrains, Developer Ecosystem 2025 | burnout rate 61% at 1 to 2 years of experience, 38% at 16+ years; 24,534 developers | real; the page does not define the rate |
| 2 in 5 tech workers are at high risk of burnout | Yerbo, State of Burnout in Tech, 2022 | we could not open report.yerbo.co (Cloudflare error 522) in November 2026; recaps give sample sizes from 30,000 to 36,200 | could not open the primary source |
| 47% of developers track their wellbeing with apps | ITPro (republished by Harness), 2024, citing JetBrains | the JetBrains 2023 page we checked says burned-out developers are “6 percentage points more likely to use self-monitoring apps”; no 47% on that page | not on the page cited |
| Unstable priorities mean 40% higher burnout risk | blog summaries of DORA 2024 | DORA 2024 says “substantial increases in burnout”; the report text has no 40% figure for burnout | not in the report |
The pattern is the usual one: a real study, a precise sentence, and then a recap that drops the wording (“in their career”, “any degree”) or adds a number the report never gave.
What causes it: the evidence that holds up
Unstable priorities, more than anything else
DORA’s 2024 report, the tenth in a series that has “heard from more than 39,000 professionals”, puts it plainly: “Unstable organizational priorities lead to meaningful decreases in productivity and substantial increases in burnout, even when organizations have strong leaders, good internal documents, and a user-centric approach to software development.”
The team tested whether good leadership, documentation or a user focus could counteract shifting priorities. “The answer is: They can’t.” Their explanation is that unstable priorities increase burnout “by creating unclear expectations, decreasing employees’ sense of control, and increasing the size of their workloads”. The report is careful about the cause: the problem is not that priorities change, but chronic instability, which “increases uncertainty and decreases perceived control”.
One finding cuts the other way, and DORA calls it “a little puzzling”: when priorities stabilized, software delivery performance declined. Stable priorities are good for people; they are not a free speed-up.
Workload, inefficient process and unclear goals
Haystack’s respondents named the top causes of their burnout: high workload (47%), inefficient process (31%) and unclear goals and targets (29%). All three are things a team lead can see and change, which is the useful part of the study.
What helps: leaders and users
DORA links two things to less burnout. Transformational leadership improves productivity and job satisfaction “while also helping decrease employee burnout”; in its model, raising transformational leadership by 25% comes with a 9% rise in productivity. And teams that build with the user in mind are “more productive, less prone to experiencing burnout, and more likely to build high quality products”.
What has not helped yet: AI
Developers hoped AI would take the drudgery away. DORA’s 2024 data says it has not, yet: AI makes valuable tasks easier and faster, “while toil and burnout remain unchanged, obstinate in the face of AI adoption”, because “AI hasn’t cracked the code of helping us avoid the drudgery of meetings, bureaucracy, and many other toilsome tasks”.
Platforms with unstable changes
A smaller DORA finding: teams using an internal developer platform saw a 14% decrease in change stability, and “instability in combination with a platform is linked to higher levels of burnout”. DORA is explicit that this does not mean platforms cause burnout; teams already struggling may be the ones that build platforms. It is a reason to watch rework and failed changes after a platform rollout.
What the academic research adds
A 2023 systematic mapping study in Information and Software Technology, “Burnout in software engineering”, found 92 research articles on burnout among developers and IT professionals going back to the early 1990s. Its authors note the field’s shift from interviews to data, and that “The emergence of machine learning (ML) approaches to detect burnout in developers has become a de-facto standard”. Detection is popular; the studies that test what prevents burnout are fewer.
Warning signs a team can see in its own work
Burnout cannot be read off a dashboard. The conditions the research links to it often can, and most of them already sit in Jira. Treat them as reasons to talk, never as a score.
| Driver in the research | What it looks like in day-to-day work | Where it shows in Jira |
|---|---|---|
| Unstable priorities (DORA) | the sprint is replanned, “urgent” work arrives mid-sprint | priority changes in work item history; scope added after sprint start in the Sprint Report |
| High workload (Haystack) | long days, weekend commits, logged time far over estimates | logged time against estimates; many unresolved items per person |
| Inefficient process (Haystack) | waiting on reviews, approvals and environments | long time in status; blocked work items |
| Unclear goals (Haystack) | work restarted because the ask was wrong | reopened items; long-running items without progress |
| Change instability (DORA) | rework after releases, firefighting | bugs linked to recent releases; reopened items |
| Deadline pressure | a pile of overdue work that never shrinks | overdue and due-soon items; for service teams, SLAs near breach |
Three rules keep this helpful rather than harmful. Look at trends over weeks, not one bad sprint. Look at the team before the person. And let each person see their own signals first; numbers that a manager uses to rank people turn a wellbeing signal into one more source of stress.
What the evidence says to do
- Stabilize priorities, and shield the team from the rest. DORA’s recommendation is direct: aside from creating stability, “there’s not much organizations can do to avoid burnout aside from finding ways to (1) stabilize priorities and (2) shield employees from having their day-to-day be impacted by the constant shift in priorities.” In practice: freeze sprint scope, route new requests through one person, and change the roadmap on a fixed rhythm instead of every week.
- Cut the workload you can see. Limit work in progress, close or drop stale items, and plan sprints on the capacity people really have; our sprint capacity calculator takes holidays and days off into account.
- Remove toil. Inefficient process was the second cause in Haystack’s study, and AI has not removed it, per DORA. Find the waits: reviews, flaky pipelines, approvals.
- Make goals clear before work starts. Unclear goals were named by 29% of Haystack’s respondents. A written “why” and “done” on every epic is cheap.
- Do not buy speed with hours. In Pencavel’s study of working hours, output rose in step with hours only below about 49 a week, and 70 hours produced about what 56 did. Our overwork cost simulator runs those estimates for your team’s hours.
- Offer support. Only 11% of developers at small organizations said their employer offers mental health support, against 47% at large ones (JetBrains 2025). A small company can close that gap with a policy and a budget line.
Where Burnout Radar fits
Burnout Radar is our Jira app for the signals in the table above, built around the privacy rules in it. Each person gets a private weekly or monthly report from their own Jira work: logged time against estimates, overdue and due-soon issues, unresolved and blocked work, high-priority work, long-running issues and SLAs near breach, each figure shown next to the limit it was compared with. Nobody else sees a report unless its owner shares it; Jira and project admins cannot open it. Team leads see totals only, how many people raised each signal, and only for weeks with at least five reports, so no one is singled out. A private weekly check-in asks how the week felt.
What it is not: a medical tool or a diagnosis (the WHO does not classify burnout as a medical condition), a way for managers to monitor individuals, or a system of automatic alerts. It counts Jira work, so it misses everything outside Jira: on-call nights, Slack, meetings. It is a prompt to look up from the board, not an answer.
Sources
- WHO, Burn-out an “occupational phenomenon”, 28 May 2019.
- JetBrains, State of Developer Ecosystem 2023 (26,348 developers) and 2025, Life and work (24,534 developers, April to June 2025).
- DORA, Accelerate State of DevOps Report 2024, version 2024.3: the burnout passages on stable priorities, leadership, user-centricity, AI and platform engineering.
- Haystack Analytics, 83% of developers suffer from burnout, 12 July 2021.
- Tulili, Capiluppi and Rastogi, “Burnout in software engineering: A systematic mapping study”, Information and Software Technology 155 (2023), abstract.
- ITPro, republished by Harness, Burnout is now rife across the software community, 4 March 2024, for the fact check.
All pages read in November 2026; the quotes above are verbatim.
Frequently asked questions
What is developer burnout?
The WHO's ICD-11 calls burn-out "a syndrome conceptualized as resulting from chronic workplace stress that has not been successfully managed", with three dimensions: exhaustion, "increased mental distance from one's job" or cynicism, and "reduced professional efficacy". It "refers specifically to phenomena in the occupational context", and the WHO says "It is not classified as a medical condition." Developer burnout is that syndrome in software work.
How common is burnout among software developers?
It depends on the question. In JetBrains' 2023 survey of 26,348 developers, 73% "have experienced burnout in their career". In JetBrains' 2025 survey (24,534 developers) the burnout rate was 61% among developers with 1 to 2 years of experience and 38% among those with 16 or more. Haystack Analytics' 2021 study found 83% "suffer from workplace burnout", counting any degree.
What causes developer burnout?
The strongest evidence points to the work environment. DORA's 2024 report found that unstable organizational priorities lead to "substantial increases in burnout", and that strong leaders, good documentation and a user focus could not offset it. Haystack's respondents named high workload (47%), inefficient process (31%) and unclear goals and targets (29%). Transformational leadership and a user-centred way of working were linked to less burnout.
Is the "83% of developers are burned out" statistic real?
Yes, it comes from Haystack Analytics, with fieldwork by the research agency Survation in June 2021, during the pandemic. Two things to know before quoting it: it counts burnout of any degree, mild included, and the press release does not give the sample size. For a larger and more recent sample, JetBrains' 2023 figure is 73% of 26,348 developers, "in their career".
Does AI reduce developer burnout?
Not so far, according to DORA 2024. It found that AI makes valuable tasks easier and faster but is not helping with the tasks people do not enjoy, while "toil and burnout remain unchanged, obstinate in the face of AI adoption". Its estimates show AI adoption improving flow, productivity and job satisfaction, not burnout.
What are the early warning signs of burnout in a dev team?
The WHO's three dimensions give the shape: exhaustion, distance or cynicism about the job, and a feeling of getting less done. In a team's day-to-day work they tend to show up as long hours and logged time well over estimates, a growing pile of overdue and blocked work, priorities that change every week, and more rework. None of these proves burnout, and none should be used to judge a single person; they are reasons to ask how people are doing.
Can you measure burnout from Jira data?
No tool can diagnose burnout from Jira, and the WHO does not treat it as a medical condition anyway. Jira can show the conditions research links to it: workload, overdue and blocked work, priority churn and long-running issues. Used privately by the person, or as team totals without names, those signals can start a conversation earlier. Used to rank individuals, they do harm.
Keep reading
- Jira, JSM and the Marketplace · 18 minJira Deadlines: Due Date JQL, Reminders, the Day Rule (2026)
- Jira, JSM and the Marketplace · 8 minJira Status Report: Weekly Template and 6 Tested JQL Queries
- Jira, JSM and the Marketplace · 13 minJira Plugins for Developers: 211 Apps Ranked by Installs
- Free toolSprint capacity calculator