Upstream for Jira Service Management – Step-by-Step Guide
How to use Upstream step by step: open it, replay a recorded incident, read the Live verdict, run the incident loop, bind request types to vendors, tune the detector and add your own status pages.
Upstream tells your service desk whether an outage is your vendor’s or yours, and runs the customer side of it. This guide walks through every screen in the order you will use them.
How to read the pictures. Every screenshot comes from a real Jira site. The red boxes with numbers show where to look or click. Number 1 in the picture is step 1 under it, number 2 is step 2, and so on.
Get started in 3 minutes
- Install Upstream from the Atlassian Marketplace (a site admin). On install, approve the vendors’ status page domains Upstream reads.
- Open your Jira Service Management project and choose Upstream in the project’s sidebar.
- On the Get started tab press Replay now: a recorded Stripe outage plays from spike to close-out in 20 seconds.
- Open the Live tab: your vendors’ status right now and the verdict for your desk.
Jira and Confluence. Upstream needs Jira with Jira Service Management. Confluence is optional: it is used only to publish the post-incident note as a page. Without Confluence everything else works, and the note can be copied instead.
1. Open Upstream
Upstream lives in your service project like any other page.
- Open your service project and click Upstream in the sidebar. If the sidebar is hidden, click the sidebar icon in the top-left corner of Jira first.
The page has eight tabs: Live, Incidents, Dependencies, Vendor ledger, Detector, Settings, Get started and Under the hood.
2. See it work on a recorded incident
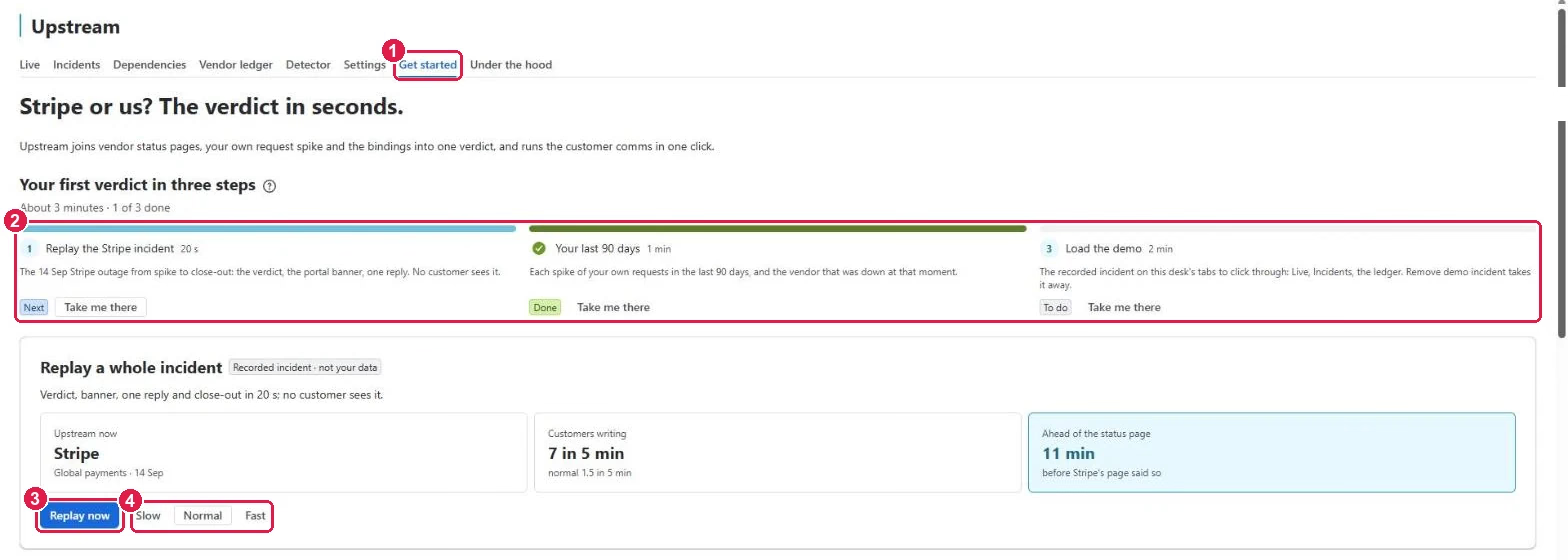
- Click the Get started tab.
- Your first verdict in three steps. Each step has Take me there:
- Replay the Stripe incident — a recorded outage, 20 seconds.
- Your last 90 days — each spike in your own requests of the last 90 days, and the vendor that was down at that moment.
- Load the demo — the recorded incident on this desk’s tabs to click through. Remove demo incident takes it away.
- Press Replay now. Watch the verdict, the portal banner, one reply and the close-out appear. No customer sees any of it.
- Pick Slow, Normal or Fast for the replay speed.
3. Read the Live verdict
- Click the Live tab.
- The verdict says in one line what is going on: a vendor is down, your desk has a spike, both, or nothing.
- Vendors: one card per vendor. The small bars show the last hours; the label says Operational or Degraded. A degraded card lists the vendor’s incidents and links to the open incident on the Incidents tab.
- Requests: your desk’s customer requests of the last 2 hours against their normal level.
- Replay the Stripe incident is always one click away at the top.
Upstream checks the status pages every few minutes; Feeds checked … ago says when.
4. Run the incident loop
- Click the Incidents tab. It shows the open incident, for example ITS-6308 · Twilio degraded.
- Do all four runs every step of the loop that is still waiting.
- The loop, step by step:
- Incident opened — a Jira work item for the vendor outage.
- Portal banner — shown on the request types bound to this vendor. Take the banner down removes it.
- One reply to the linked requests — the same reply to every customer request linked to the incident.
- Close-out when the vendor says resolved — the banner comes down and the closing comment is drafted when the vendor’s page says operational.
- Texts: the banner and the reply. Edit texts to change them before they go out.
- Timeline: what happened and when, in UTC.
5. Tell Upstream which request types belong to which vendor
- Click the Dependencies tab.
- Bindings: each vendor service and the request types bound to it. Keywords bind most types on their own; the Status column says by hand when a person bound it, and shows an open incident.
- Edit a row to add or turn off a request type for that vendor (a project admin).
- Propose from request text reads the titles of this desk’s requests of the last year, as you, and proposes a binding where a vendor’s keywords appear 3 or more times and the type is not bound yet. Only the vendor, the request type and the count are kept — never a title. You accept or dismiss each proposal.
- Try a customer request: type what a customer writes, for example card declined at checkout, and press Check — Upstream says which vendor it points to.
- Rehearse an outage: pick a vendor and see, from your own hourly levels, how fast Upstream would have called it. Nothing is written.
6. Keep a ledger of your vendors
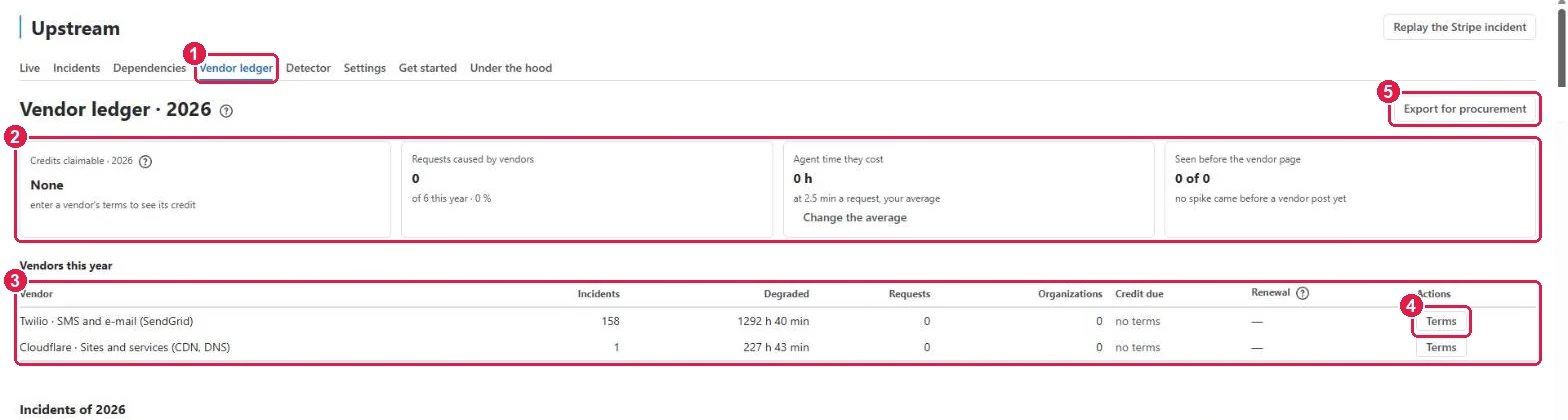
- Click the Vendor ledger tab.
- The year in four numbers: service credits you can claim, requests vendors caused, the agent time they cost (Change the average sets the minutes per request), and how often Upstream saw it before the vendor’s page did.
- Vendors this year: incidents, hours degraded, requests and organizations affected, the credit due and the renewal date.
- Terms: enter a vendor’s SLA terms to see the credit you can claim.
- Export for procurement downloads the ledger for your renewal talks.
Under it, Incidents of the year lists every vendor post with its times; missed by us marks the ones your desk felt no spike for.
7. Tune the detector
- Click the Detector tab. Its baseline is the last 4 weeks at the same hour of the week.
- Now: for each request type, the normal number of requests in 5 minutes, the number now and the verdict.
- Spikes · last 30 days: every spike with its verdict. Check again reads the newest minutes. A spike that was not a vendor can be dismissed.
- Band width: how far above normal counts as a spike — 2 is sensitive, 6 is calm.
- Minimum requests in 5 minutes: below this number nothing is a spike, however quiet the hour was.
- Vendor keywords: comma-separated words for each vendor. A request type whose name holds one is bound to that vendor; a request whose title says one counts toward the verdict.
8. Settings: your own status pages and vendors
- Click the Settings tab.
- Your own status domains: status pages you added, with Edit and Remove. The line under them counts how many of the site’s 10 approved domains are used.
- To add one, type its Status page domain (for example
status.digitalocean.com), optionally a name and what it covers, and press Allow domain. Atlassian then asks a site admin to approve the domain — press Approve. Any Statuspage page works. - Vendors this desk follows: click a vendor to follow or stop following it.
- Press Save the vendors.
Further down, Data sources and terms lists where each vendor’s status comes from and how often it is checked.
9. The agent in Rovo (optional)
On sites with Rovo, the Upstream agent answers “Is it them?”, gives a vendor’s status, drafts customer comms, opens an incident and adds an incident note — each only when you ask.
- Open Rovo and choose the Upstream agent, or open it from a request.
- Ask, for example, “Are the payment requests in the last hour Stripe’s fault?”
- Optional: Atlassian Administration → Connected apps → Upstream → Tools switches on the MCP tools for an AI client.
Under the hood
The Under the hood tab shows how the app works, what it keeps and for how long, which permissions it asks for and why, and a self-check that tests every part on your site. Run it when something looks wrong and send us the result.
Need help?
Write to us through our Support Desk. Read how your data is handled in the privacy policy.