Build Map for Jira – Step-by-Step Guide
How to use Build Map step by step: open it, load the demo town, read the map and the workable hours, plan around the weather and permits, and set it up for your own network.
Build Map shows your fibre rollout on a street map in Jira, tells you which outdoor work the weather stops, and proposes a better plan. This guide walks through every screen in the order you will use them.
How to read the pictures. Every screenshot comes from a real Jira site. The red boxes with numbers show where to look or click. Number 1 in the picture is step 1 under it, number 2 is step 2, and so on.
Get started in 3 minutes
- Install Build Map from the Atlassian Marketplace for Jira and Confluence (a site admin).
- Open any Jira project and choose Build Map in the project’s sidebar.
- Open the Get started tab and press Load the demo town. About 30 seconds later the demo project BMD is ready.
- Press Open the demo town, then drag the forecast hour on the map: blocked work turns orange and comes back as the rain stops.
Jira and Confluence. Build Map needs Jira. Confluence is optional: it holds the weekly report and the drafts of permit letters. Without Confluence the map, the planner, the weather and the contractor and resident portal work; Settings → Reports says there is no space to choose.
1. Open Build Map
Build Map lives in your Jira project like any other page.
- Open a Jira project and click Build Map in the sidebar. If the sidebar is hidden, click the sidebar icon in the top-left corner of Jira first.
The page has six tabs: Map, Plan, Weather, Settings, Get started and Under the hood.
2. Load the demo town (or your own design)
The fastest way to learn the app is the demo town: a small fibre rollout on real streets in Oslo. Everything it makes is marked TEST and can be removed in one click.
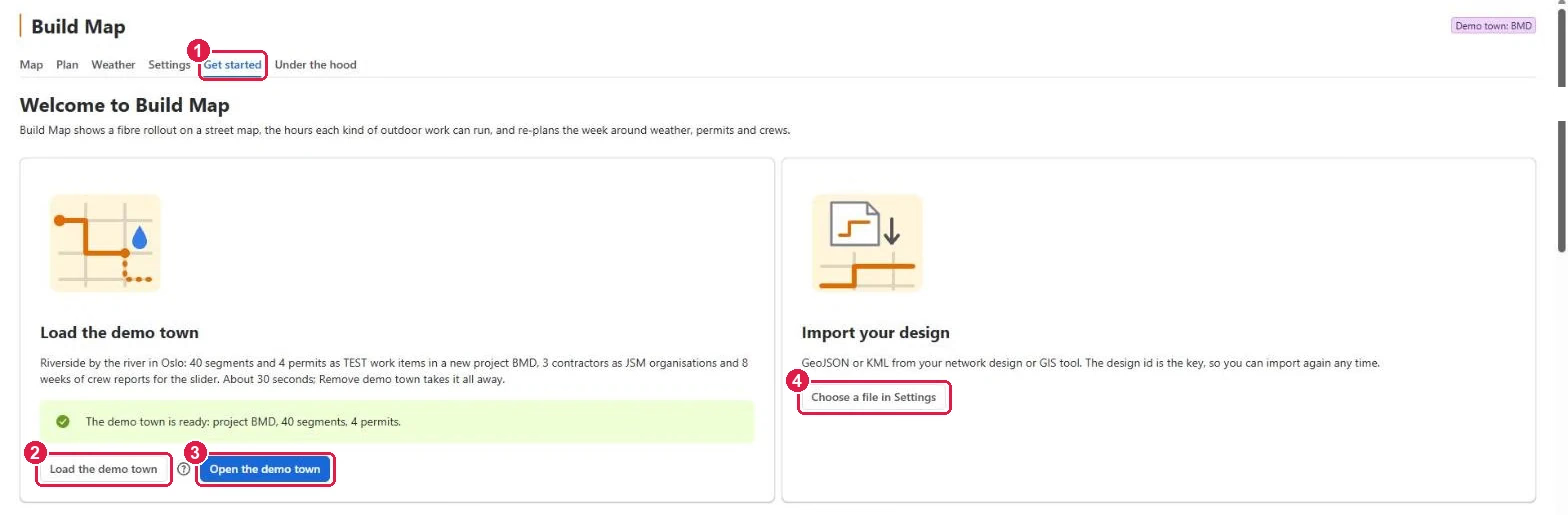
- Click the Get started tab.
- Click Load the demo town. You need to be a Jira admin. It takes about 30 seconds and creates the project BMD with 40 segments, 4 permits, 3 contractors and 8 weeks of crew reports.
- When the green message says the town is ready, click Open the demo town.
- To use your own network instead, click Choose a file in Settings (see Import your design).
Below the cards, Your first map in three steps shows what is done and what is next.
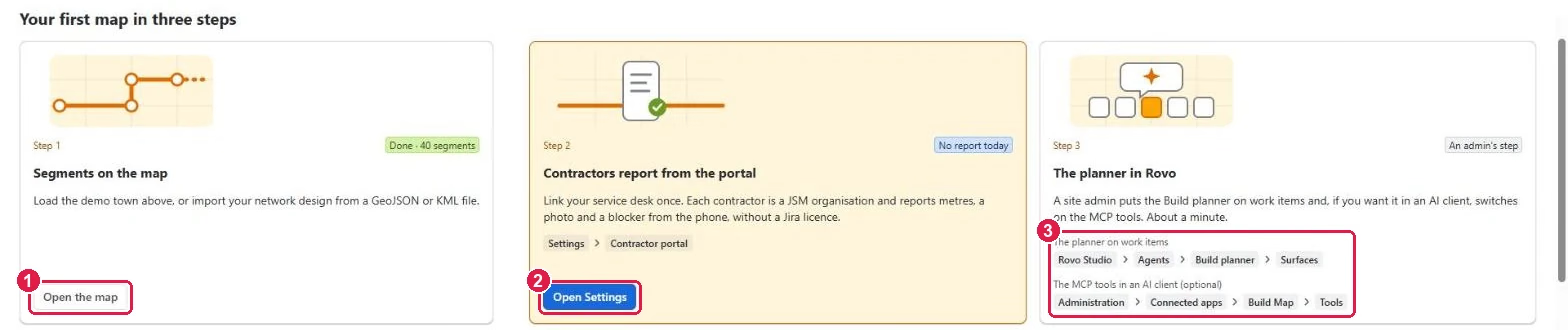
- Open the map shows your segments.
- Open Settings goes to the contractor portal setting, so contractors can report from their phones.
- The grey labels show where a site admin clicks to put the Build planner on work items in Rovo, and (optional) to switch on the MCP tools for an AI client.
Remove the demo: on the Get started tab press Remove demo town. The project goes to the Jira trash, where it can be restored for 60 days.
3. Read the map
- Click the Map tab.
- Drag the forecast hour jumps to the slider under the map.
- Today’s workable hours: for the next 24 hours, each kind of work gets one bar per hour. Green — the crew can work. Red — rain or wind stops it. Grey — too dark for daylight work, or no forecast. The number on the right is the hours the crew can work.
- Contractor: click a contractor to see only its work, or All.
The four boxes in the middle count homes passed, metres built this week, how much is on plan, and permits still pending.
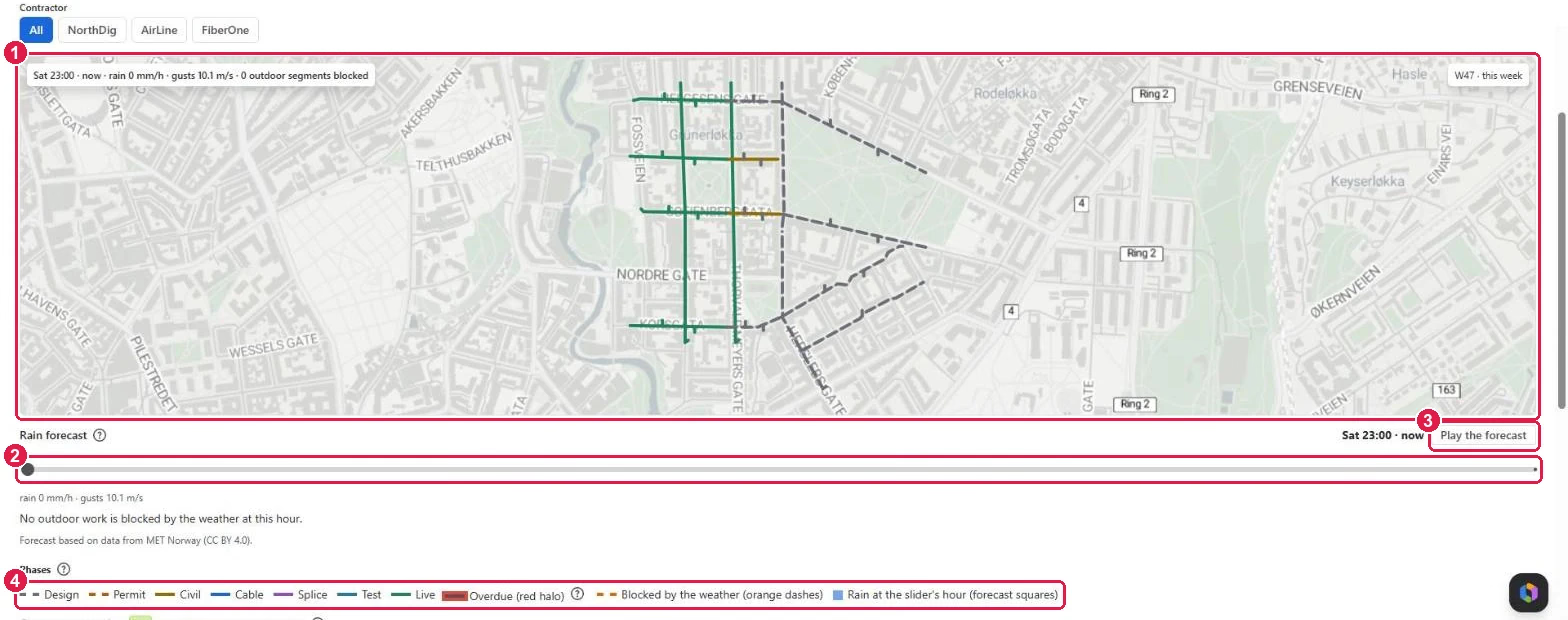
- The map. Each line is a segment (a Jira work item). Its colour is its phase; dashed lines are planned but not built yet. Zoom with the mouse wheel or + / −, move with the arrow keys. Click a segment to see its work item.
- The forecast slider. Drag it to an hour in the next days. Segments the weather stops at that hour turn into orange dashes, and blue squares show the rain.
- Play the forecast moves the slider by itself, hour by hour.
- The legend says what each colour means. Click ? for more.
4. Plan the weeks
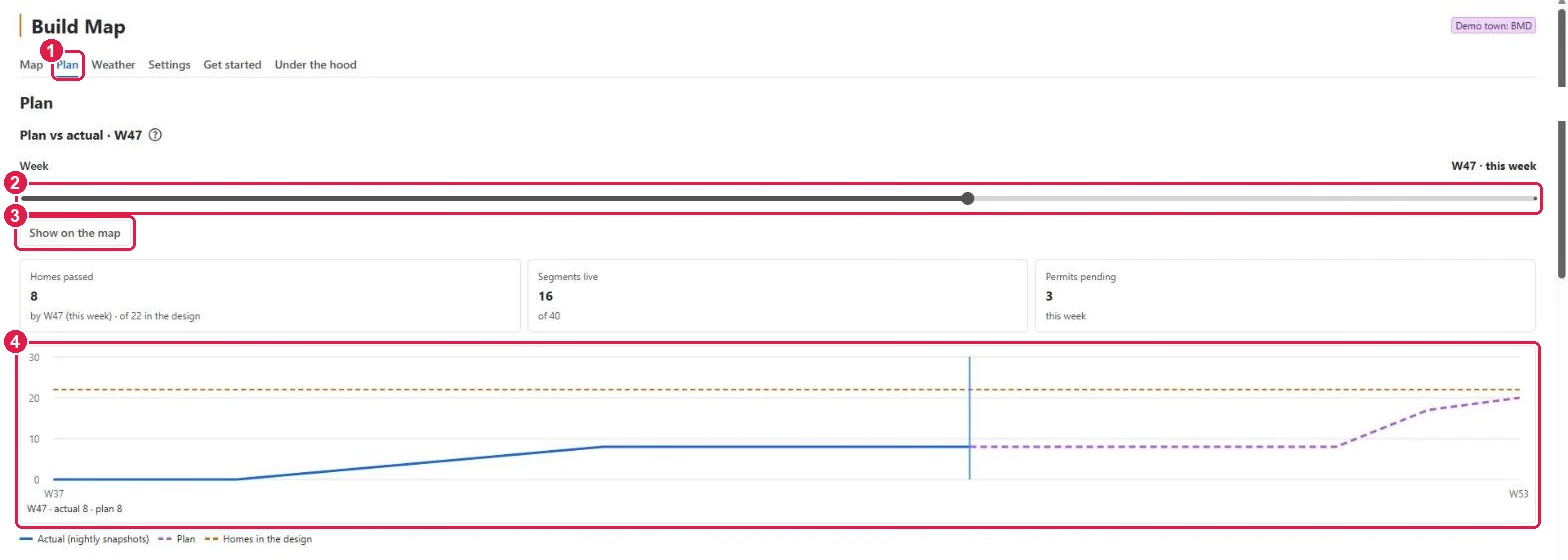
- Click the Plan tab.
- Drag the Week slider to any week of the rollout. The boxes under it show homes passed, segments live and permits pending in that week.
- Show on the map opens the map as it was (or is planned to be) in that week.
- The chart: the blue line is what was really built (from nightly snapshots), the purple dashes are the plan, the orange dashes are all the homes in the design.
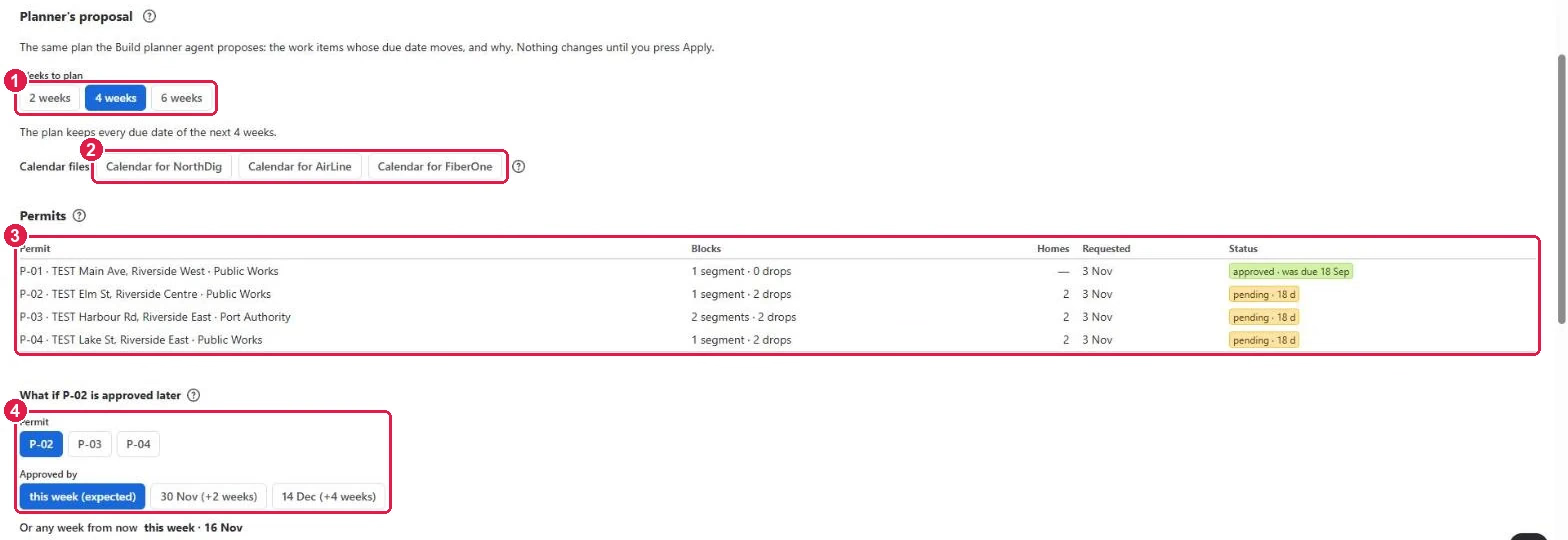
- Weeks to plan: how far ahead the planner looks. The planner’s proposal under it lists the work items whose due date it would move, and why — rain, a pending permit, a blocking segment or the contractor’s capacity. Nothing changes until you press Apply; each move is made as you and assigns the work to the crew lead.
- Calendar files: download a calendar for each contractor with its crews’ work.
- Permits: each permit, how many segments and homes it blocks, when it was requested and its status.
- What if a permit comes later? Pick a permit and a later approval date to see how many homes and how much money the delay costs this year.
5. Check the weather
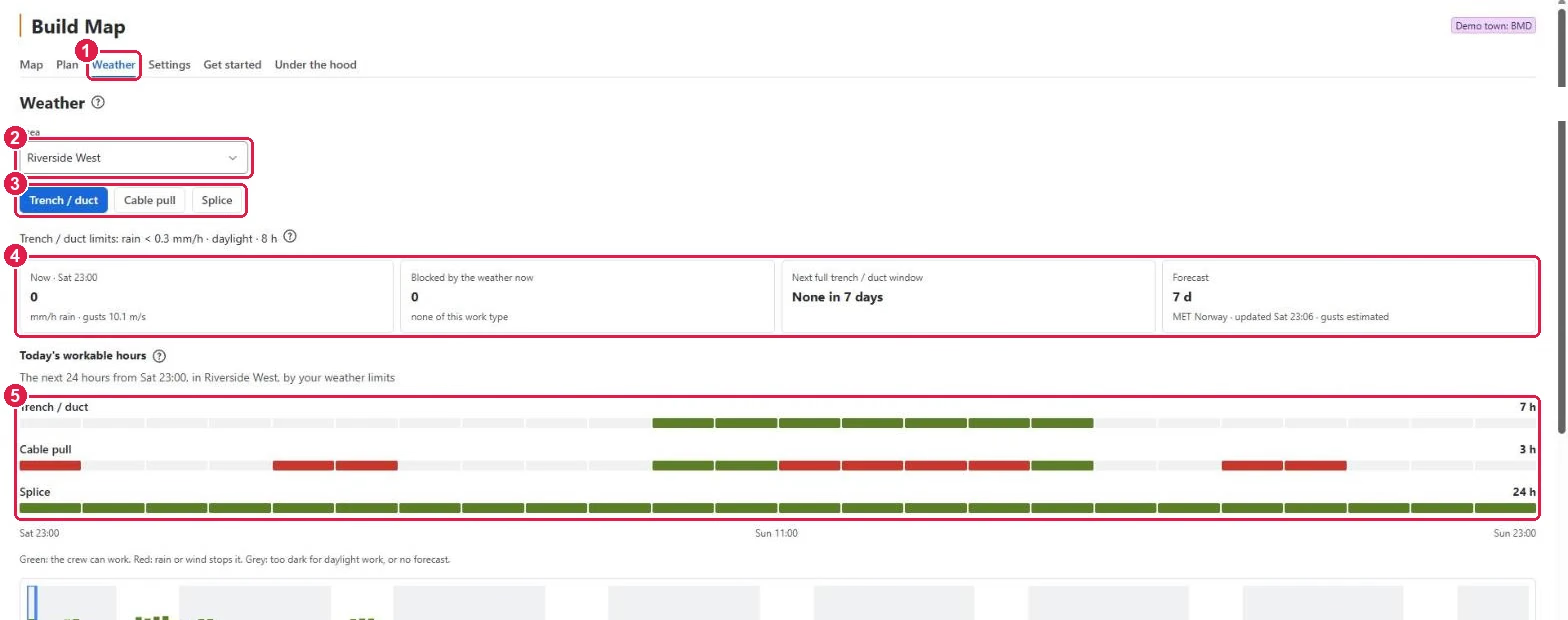
- Click the Weather tab.
- Area: pick the part of the network to look at.
- Pick the kind of work. The line under it repeats your limits for it, for example rain below 0.3 mm/h, daylight, 8 hours.
- The boxes show the weather now, how much work it blocks now, the next full window long enough for the work, and how far the forecast reaches.
- Today’s workable hours and, under it, the rain of the next 7 days hour by hour.
The forecast comes from MET Norway (CC BY 4.0) and is checked again every hour.
6. Use the planner in Rovo (optional)
On sites with Rovo, the Build planner agent plans the week from the same facts, moves tasks out of the rain and drafts a permit letter.
- A site admin opens Rovo Studio → Agents → Build planner → Surfaces and turns on Work items. The planner then appears in a work item’s agent picker.
- Ask it, for example, “What does the rain stop this week?” It answers with the work items and proposes moves; you apply them.
- Optional: Atlassian Administration → Connected apps → Build Map → Tools switches on the MCP tools, so an AI client can call the planner.
7. Settings
Settings are on the Settings tab. Most of them need a Jira admin.
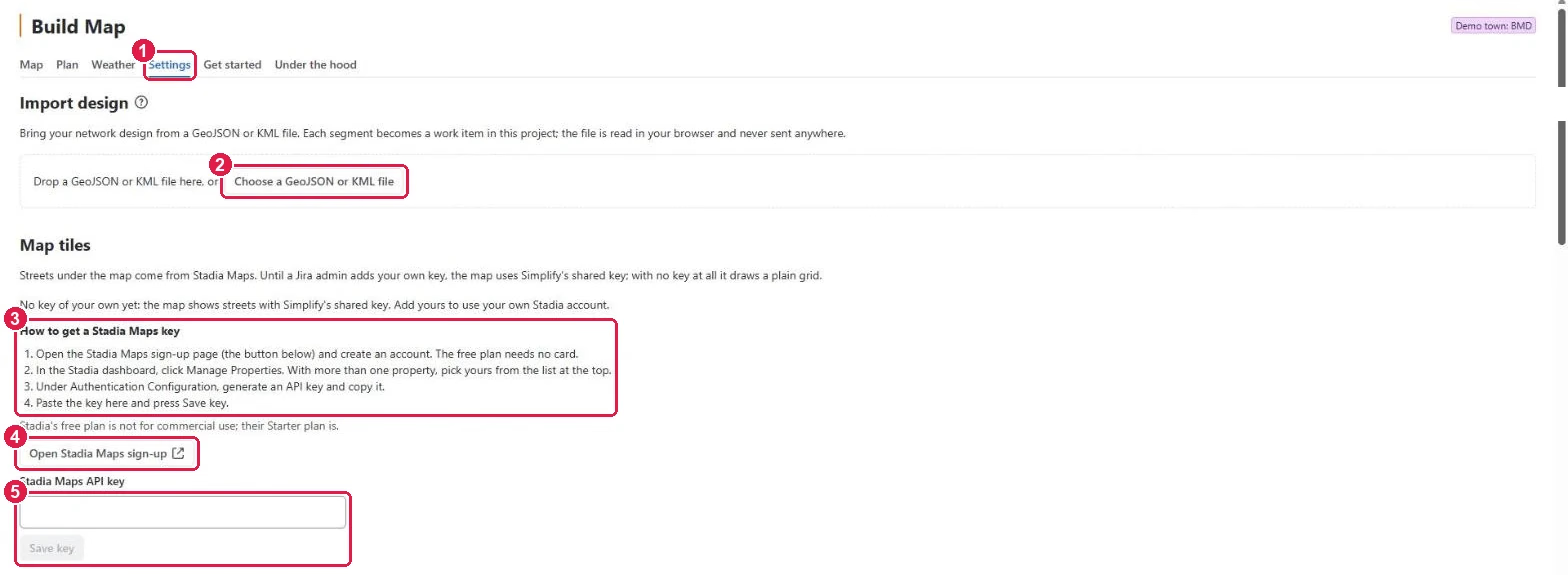
- Click the Settings tab.
- Import design: click Choose a GeoJSON or KML file (or drop the file on the box). Each segment becomes a work item in this project. The file is read in your browser and never sent anywhere. Import again at any time: the design id is the key, so nothing is duplicated.
- Map tiles: the streets under the map come from Stadia Maps. Until you add your own key, the map uses Simplify’s shared key. The four steps say how to get your own key.
- Open Stadia Maps sign-up opens Stadia’s page in a new tab (Jira asks first). Create an account, click Manage Properties, and under Authentication Configuration generate an API key.
- Paste the key into Stadia Maps API key and press Save key. Remove key goes back to the shared key.
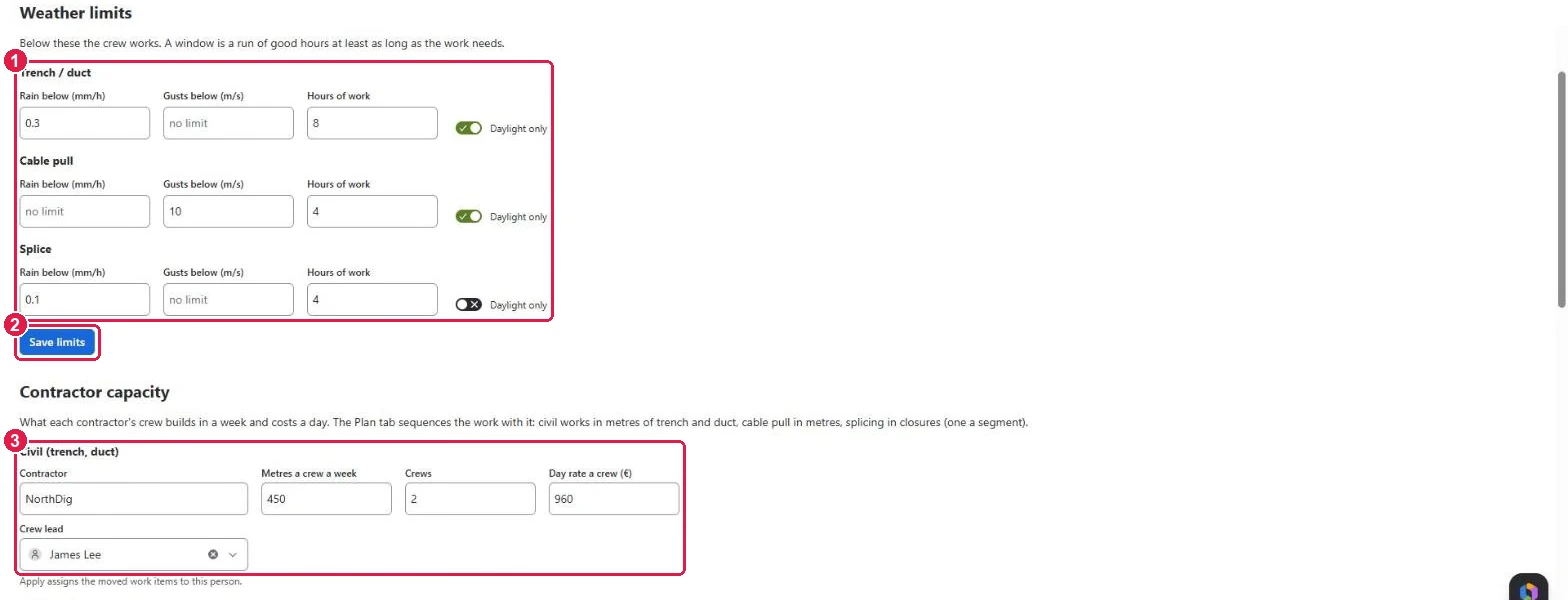
- Weather limits: for each kind of work, the rain (mm/h) and gusts (m/s) below which the crew works, how many hours in a row the work needs, and whether it needs daylight. Leave a box empty for no limit.
- Press Save limits. The map, the Weather tab and the planner use the new limits at once.
- Contractor capacity: for civil works, cable pull and splicing — the contractor’s name, how much one crew builds in a week, how many crews, the day rate, and the crew lead who gets the moved work items. Press Save capacity.
Investor week (optional): a week such as 2026-W48 to compare the plan against on the Plan tab.
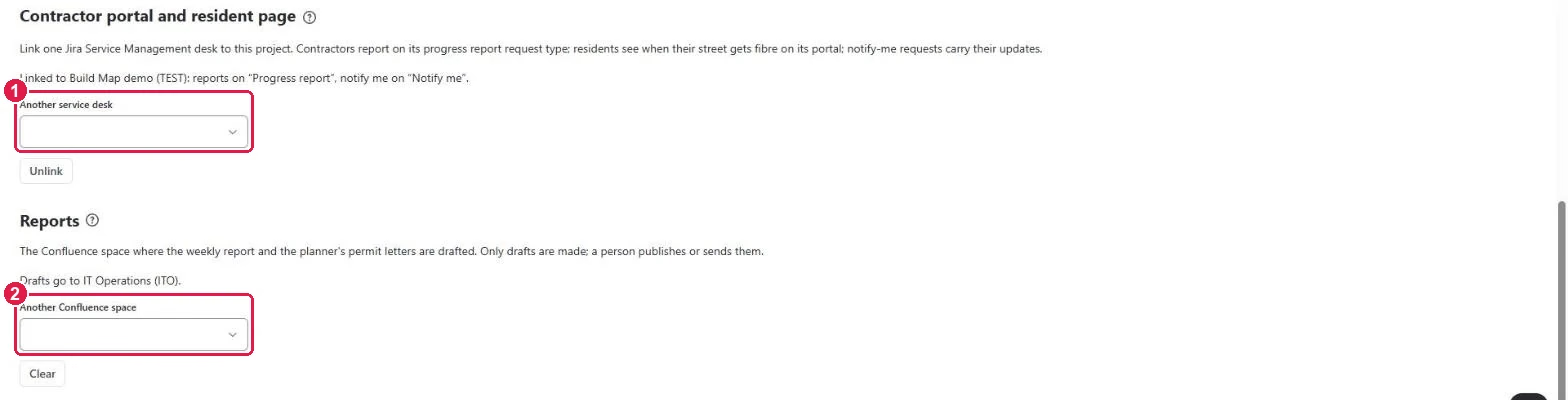
- Contractor portal and resident page: pick the Jira Service Management desk to link to this project. Contractors report on its Progress report request type; residents see their street’s date on its portal and can ask to be notified. Unlink removes the link.
- Reports: pick the Confluence space where the weekly report and the planner’s permit letters are drafted. The app only makes drafts; a person publishes or sends them.
Contractors: send a progress report
Contractors don’t need a Jira licence.
- A Jira admin adds each contractor as a JSM organisation of the linked desk (the demo town does this for you).
- The contractor opens the help center on the phone and chooses Progress report.
- They pick the segment, type the percent done, add a photo and, if something is in the way, a blocker, then press Send.
- The report appears on the map at once (Crew reports today, no reload) and the planner reads the blocker.
Residents: when does my street get fibre?
- A resident opens the help center and looks up their street. They see its step and the week it is planned for.
- Notify me raises a request; when the street’s date moves, the app adds a comment to that request.
- To let residents in without signing in, a Jira admin opens the desk’s Settings → Customer access and makes the help center open to anyone.
Under the hood
The Under the hood tab shows how the app works, what it keeps and for how long, which permissions it asks for and why, and a self-check that tests every part on your site. Run it when something looks wrong and send us the result.
Need help?
Write to us through our Support Desk. Read how your data is handled in the privacy policy.