Excalidraw Math in Jira: LaTeX Equations, Step by Step
Write LaTeX math in Excalidraw on a Jira issue: equations typeset with MathJax next to charts and diagrams, with shared scenes, history and permissions.
Excalidraw LaTeX Math puts typeset formulas on a Jira issue. You type a formula in LaTeX, it appears as a sharp picture, and you explain it by hand on a whiteboard: circle a number, add an arrow and a note, put a chart beside it.
How to read the pictures. Every screenshot comes from a real Jira site. The red boxes with numbers show where to look or click. Number 1 in the picture is step 1 in the text, number 2 is step 2, and so on.
Get started in 2 minutes
- Install Excalidraw LaTeX Math from the Atlassian Marketplace. You need to be a Jira admin. It is free for up to 10 users.
- Open an issue. Under its title, open the apps menu and choose Excalidraw LaTeX Math. The panel appears in the issue, above the activity.
- Press Edit in the panel. The editor opens over the page: draw with the hand-drawn tools, or choose Insert diagram → LaTeX Math. The dialog opens with a ready example; press Insert.
- Save. The diagram now shows on the issue for everyone who can see it.
Open the app on an issue
- Open any issue and click the apps button under its title.
- Choose Excalidraw LaTeX Math. The panel appears in the issue, above the activity.
An issue without a diagram offers three ways to start: Create diagram (a new diagram for this issue only), Choose a template → Start from this template (a copy of an existing scene) and Link a shared scene (show a scene that lives on other issues too).
The app is also on every project (in the project’s navigation, under More when the row is full) and in Jira’s sidebar under Apps → Excalidraw LaTeX Math.
The diagram on the issue: Edit, full screen, update by name
The panel shows the drawing with its name, here “This issue’s diagram”.
- Edit opens the editor.
- The full-screen button shows the drawing as large as the window, with its name, Edit and ×.
- ⋯ holds View settings and Show a shared diagram.
After Close in the editor the panel reloads in place; the page does not jump to the top.
LaTeX Math diagrams from text
- In the editor, click Insert diagram.
- Choose LaTeX Math, first in the list.
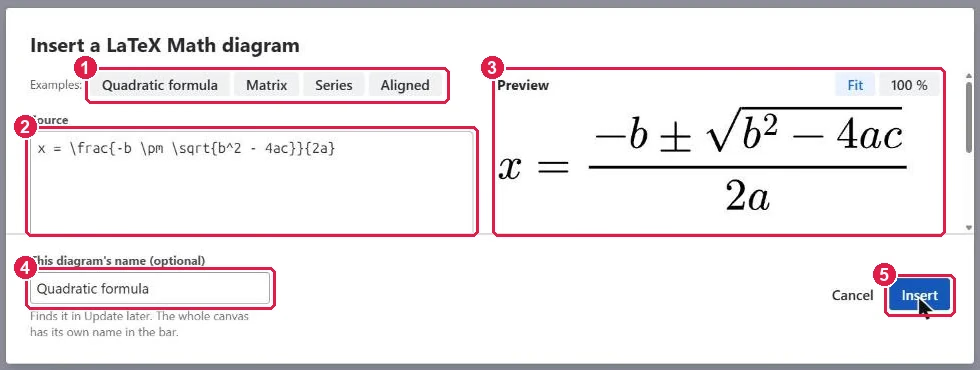
- Start from an example: Quadratic formula, Matrix, Series or Aligned.
- Type the formula in Source, in LaTeX. For example
\frac{a}{b}is a fraction and\sqrt{x}a square root. - The Preview shows the formula typeset with MathJax, as you type.
- Give it a name, so you find it in Update later.
- Press Insert. The formula lands on the canvas as a sharp vector picture.
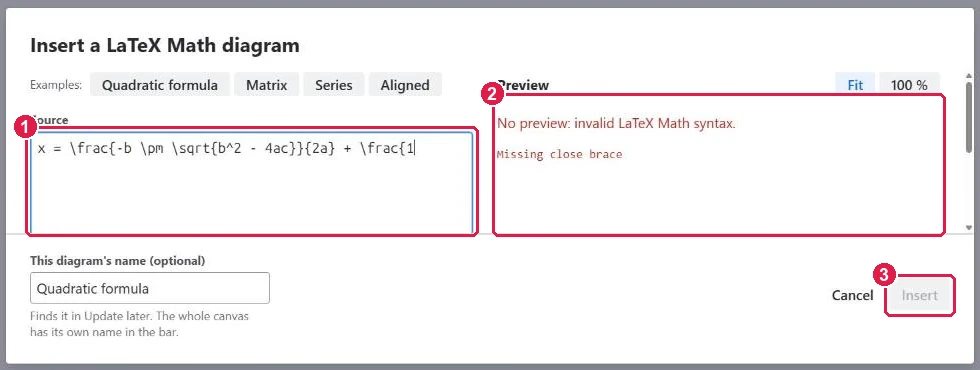
If something is wrong in the formula:
- Look at the end of the Source: here a
{is not closed. - The Preview says why it cannot draw the formula, here
Missing close brace. - Insert is greyed out until the formula is complete, so a broken formula never lands on the issue.
Fractions, matrices, aligned equations, sums and integrals all work. To change a formula later, choose Update ▾: it lists the diagrams on the canvas by name. Select a formula on the canvas and the button becomes Update “its name”; it keeps its place and scale.
Then explain it by hand: circle what matters, add arrows and notes. Put the numbers beside the formula with Insert diagram → Vega-Lite: paste the data into the chart spec, and the chart sits in the same scene.
Other diagram types in the same scene
- PlantUML: UML from text with the official PlantUML engine: sequence, class, activity, use case and state diagrams, and C4 architecture diagrams.
- Mermaid: flowcharts, sequence, class, state and ER diagrams, Gantt charts, mind maps and timelines (Mermaid 11). Insert as shapes turns a Mermaid diagram into ordinary Excalidraw shapes.
- Graphviz: graphs in Graphviz DOT with automatic layout.
- Vega-Lite: bar, line and pie charts from data you paste into the spec. The chart never loads data from a URL.
- WaveDrom: digital timing diagrams: clocks, data lines and bus groups.
PlantUML and C4 diagrams
- In the editor, open Insert diagram ▾ and choose PlantUML (second in the list).
- Pick an example: Sequence, Class, Activity, Use case, State or C4 container.
- Edit the text.
@startumland@endumlare optional, and labels can use any script, Cyrillic included. The preview redraws as you type. - Give it a name if you want to find it in Update later, then Insert.
C4 is built in. !include <C4/C4_Context>, <C4/C4_Container>, <C4/C4_Component> and the other C4-PlantUML files, and the same files linked from GitHub (raw.githubusercontent.com/plantuml-stdlib/C4-PlantUML/…), are drawn from C4-PlantUML 2.14.0 inside the app. Any other !include is refused: “External includes are not supported: everything stays inside Atlassian.”
Errors. A mistake shows as a message with the line in your own text, for example “PlantUML: Syntax Error? (Assumed diagram type: sequence) on line 2.” Insert stays off until the text draws.
All diagrams of the site
- In Jira’s sidebar, open Apps → Excalidraw LaTeX Math.
- Filter the scenes: All, Global, or one project, sorted by Last edited.
- New diagram starts a scene that does not belong to one issue.
- Each card shows a preview, the project, the last edit and the issues it is on. Its ⋯ menu has Show on Jira… (a project page or an issue) and Delete….
Show one diagram on many issues
A shared scene is one diagram shown in many places: on several issues and on the project page. A change to it shows everywhere.
- In the issue’s panel, open ⋯ → Show a shared diagram.
- Narrow the list: All, Global (the whole site) or This project, sorted by Last edited; the search box finds a scene by name. New diagram starts a new shared scene.
- Pick a scene. The one already on this issue says Shown here.
On the global page (Apps → Excalidraw LaTeX Math) each card’s ⋯ → Show on Jira… puts a scene on a project page or on an issue: choose a Project, optionally an Issue, and press Show here.
Delete… asks first: the scene disappears from every issue and page that shows it, so this cannot be undone. A scene can be deleted by its author, a project admin (project scenes) or a Jira admin (global scenes).
View settings
- Click ⋯ next to Edit on the panel and choose View settings.
- Change how the diagram looks to you; the diagram and other people’s views stay as they are.
- Max height of the panel (at least 120 px), Fit diagram to the panel width, Match Atlassian theme (Jira’s light or dark theme).
- Scroll inside the diagram lets the mouse wheel move the diagram instead of the page; Ctrl/⌘ + wheel zooms.
- The − / + / Fit buttons below the diagram zoom.
The scene’s own defaults for everyone (the project it is listed under, max height, Fit diagram and theme) are in the editor under ⋯ → Diagram settings.
Saving, history and conflicts
- Version history: History in the editor lists the last 10 saved versions. Restore saves an old version as a new one, so the current version stays in the list.
- Two people at once: if someone saved while you were editing, the app does not overwrite their work. Your changes stay in the editor and you choose: merge them with the latest version (for each shape the newer edit wins), reload the latest version, or save yours as a copy.
- Unsaved work: if the browser closes during editing, the editor offers “You have unsaved changes” with restore or discard the next time you open the scene.
- Size: a scene holds up to 5 MB, images included. The meter next to Close shows how much is used; shrink or remove images to make room.
Permissions and data
- Who can change a diagram: changing an issue’s diagram or attaching a scene needs Edit issues permission; a project’s scenes need Edit issues in that project. Everyone who can see the issue sees the diagram.
- Scopes: the app asks only to read Jira work (issues, projects) and for its own storage.
- Where data lives: scenes, their images and the text sources are stored in the app’s Forge storage inside your Atlassian site. Diagrams render in your browser; Mermaid, MathJax, Graphviz, Vega-Lite and the shape libraries ship inside the app.
- PlantUML and C4: the PlantUML engine (
@plantuml/core1.2026.9) and C4-PlantUML 2.14.0 ship inside the app and load only when a PlantUML diagram is shown or edited. Nothing is fetched from plantuml.com, GitHub or any other server. - Languages and themes: Cyrillic, Chinese and other scripts work in shapes and text; light and dark themes.
See the privacy policy.
Troubleshooting
- “The diagram could not be loaded. Check your connection and try again.” — press Try again.
- Insert is disabled in a text dialog — the preview shows the error in the source; fix the line it names.
- “No scene here yet” on a project page: choose one with Show a shared diagram.
- “This scene no longer exists” — the shared scene was deleted; show another or create a new diagram.
- “Excalidraw needs an active licence” — a Jira admin renews it in Manage apps.
Still stuck? Contact support.
Related apps
- Excalidraw Math Equations & LaTeX Whiteboard for Confluence — the same app for Confluence.
- Excalidraw Whiteboard & Mermaid Diagrams for Jira — Mermaid first.
- Excalidraw Architecture & Dependency Diagrams for Jira — Graphviz first.
- PlantUML Diagrams: UML & C4 for Jira – Excalidraw — PlantUML and C4 first.